Skip to content
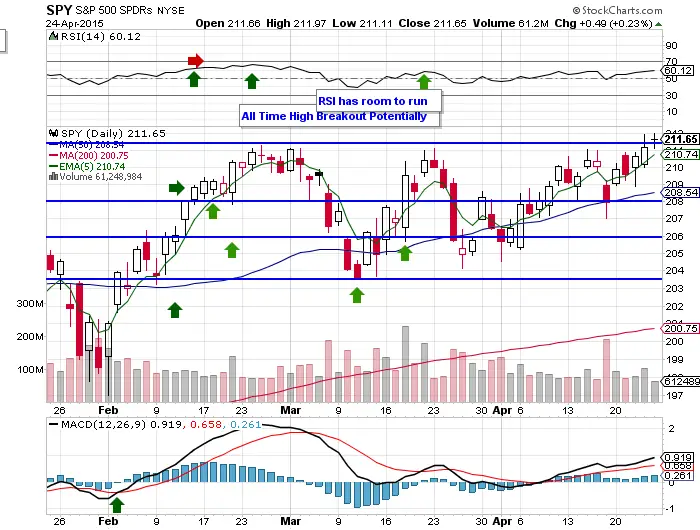
- $SPY broke out of the adjusted for dividends chart on Friday and very close to unadjusted all time highs.
- The MACD is bullish.
- $SPY held the 50 day line all week.
- $SPY has begun to show momentum by closing above the 5 day ema for five straight days.
- A 60 RSI has $SPY on the bullish side of the RSI and with some room to run higher.
- For five straight days $SPY has closed above the previous days low, this shows accumulation and is bullish.
- $SPY dips are being bought.
- All major indexes are within striking distance of all time highs.
- Many leading stocks are breaking out of bullish chart patterns. $AMZN $GOOGL $AAPL
- I am bullish here with the 68/70 RSI as my target and a close under the previous days low as my trailing stop.

