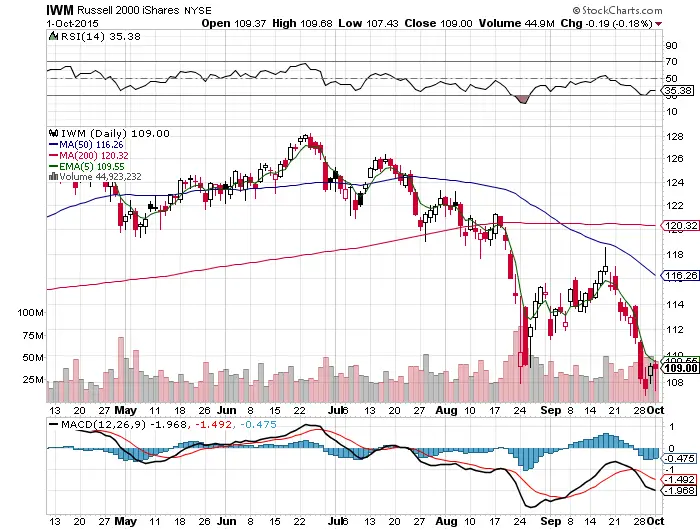
- $IWM has closed lower than the previous day 9 out of the last 10 days. This is bearish.
- Wednesday’s rally was rejected Thursday. This is bearish.
- The MACD is under a big bearish cross.
- $IWM did have a reversal candle today, but it failed to close over yesterday’s high of day.
- $IWM is down -8.9% year to date, just slightly out of correction range.
- $IWM failed to hold the 2015 crash bottom low of day this week at $108.
- The $IWM price has traded below the 5 day EMA for 10 straight days.
- The 50 day moving average is descending. This is bearish.
- $IWM did find support at the 30 RSI and stopped going lower. This is the first sign of a potential short term bottom.
- We have reached maximum bearish signals on the $IWM chart. The risk/reward ratio is skewing
I will buy dips that are extended from the 5 day EMA using the 30 RSI as an end of day stop and the 5 day EMA as a target.
