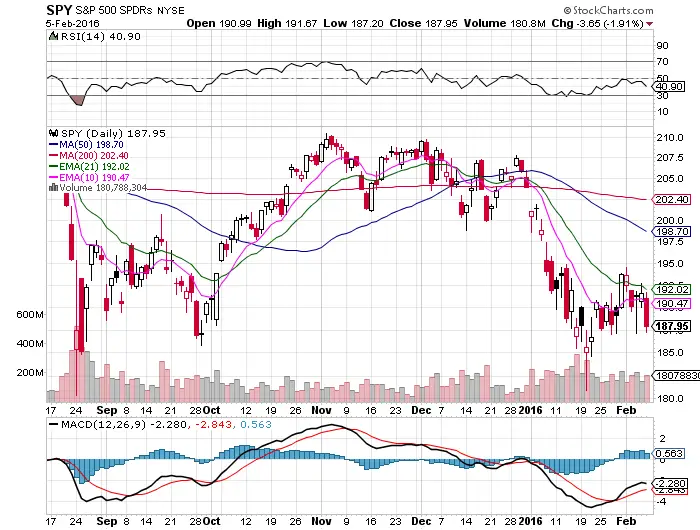
- The 200-day and 50-day are starting to descend lower, showing a long term downtrend is developing.
- We are still under a bearish 50/200 day ‘death cross’.
- $SPY has traded under the 10-day EMA for the majority of this year, demonstrating that bears have stayed in control of the market.
- $187 is the short term support level for $SPY and $180 is the long term support level.
- In this market, $SPY and $DIA are the stronger index ETFs, while $QQQ and $IWM are the weaker.
- The RSI is showing weakness at 40.90. If we see $SPY at 30 RSI, it could present a good risk/reward for a long side swing trade.
- With $NYMO at 15.23 we could see lower prices this week.
- $SPY has a 6.6% energy weighting that ties $SPY to oil prices. If oil continues to sell off, look for $SPY to follow it.
- The MACD still has a bullish crossover.
- $195 and the 21-day EMA are the two primary resistance levels.
I am looking to shift to selling this market short. I will sell rips and dips with the ongoing weakness. I prefer shorting $QQQ and $IWM over $SPY.