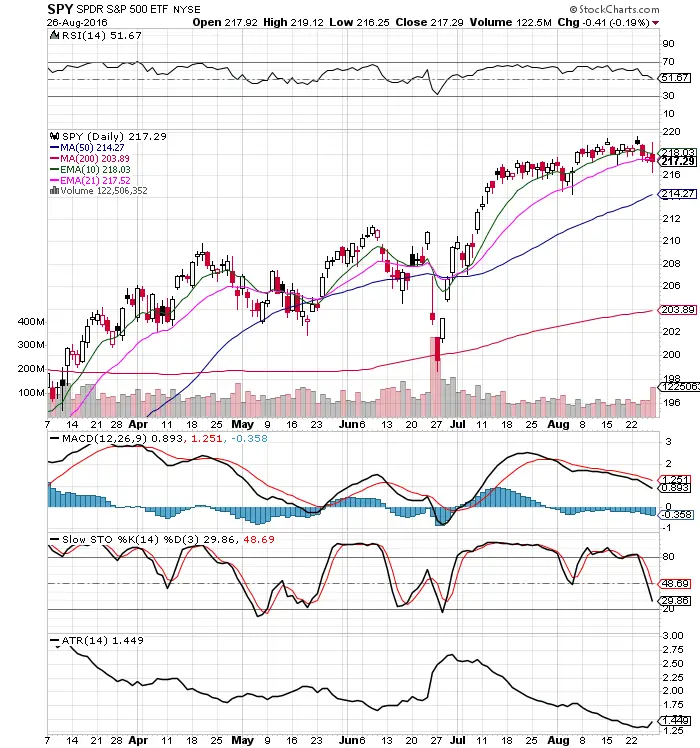
- $SPY remains in the trading range it has been in since mid July. $214.25 support and all time highs are resistance at $219.60. This is a very tight range.
- The chart is still bullish as it stays near all time highs and tries to breakout.
- We finally had some movement on Friday with ATR increasing. It is possible to see a more tradable range intra-day next week.
- Slow Stochastics is under a bearish cross and shows short term momentum is down.
- MACD has remained under a bearish cross for all of August and still points to more downside.
- RSI at 51.67 is neutral here with room to move either way.
- Wednesday, Thursday, and Friday selling was on increasing volume.
- Buying small intra-day dips in price and selling into strength continues to be rewarded.
- For trends you have to trade individual stocks as the market indexes remain stuck in a range. They seem to be at home in the range.
- The 10 day EMA and 21 day EMA supports were both lost last week and the next key moving average is the 50 day SMA, this could be a high probability confluence for a dip buy if it aligns with the 30 RSI next week.
I am currently in cash and looking to buy dips near the 30 RSI/ 50 SMA next week in the indexes.