Skip to content
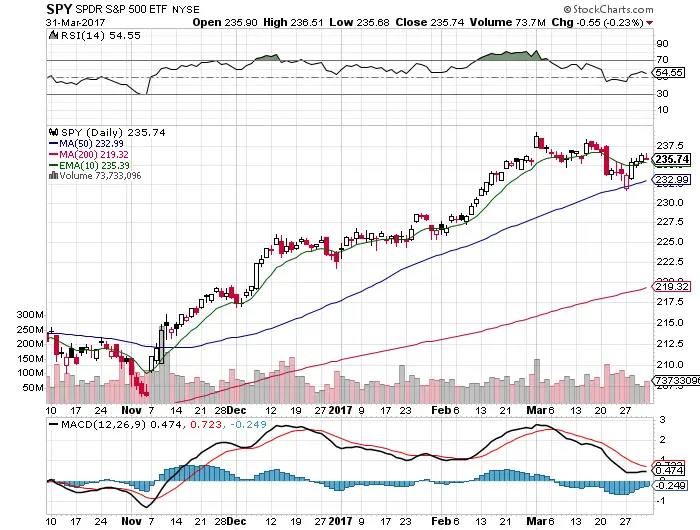
 Chart Cortesy of StockChartscom
- The long term up trend remains in place with price over all key moving averages.
- Last week price broke over the 10 day EMA signaling the possibility of another leg up on the short term up trend regaining new all time highs.
- The MACD remains under a bearish crossover showing the slowing of upside momentum as the market has been range bound in March.
- The 54.55 RSI is a slightly bullish reading and $SPY has plenty of room for price to trend up to 70 RSI before becoming over bought.
- Two up days last week were on later volume than the two down days.
- VIX at 12.37 is still a very flat market with little volatility.
- This market is in a tight range that makes it difficult to swing trade and day trade.
- Buy Hold investors love this market.
- There is nothing more bullish than an index near striking distance of all time highs.
- The edge in this market remains buying the small dips in price.
