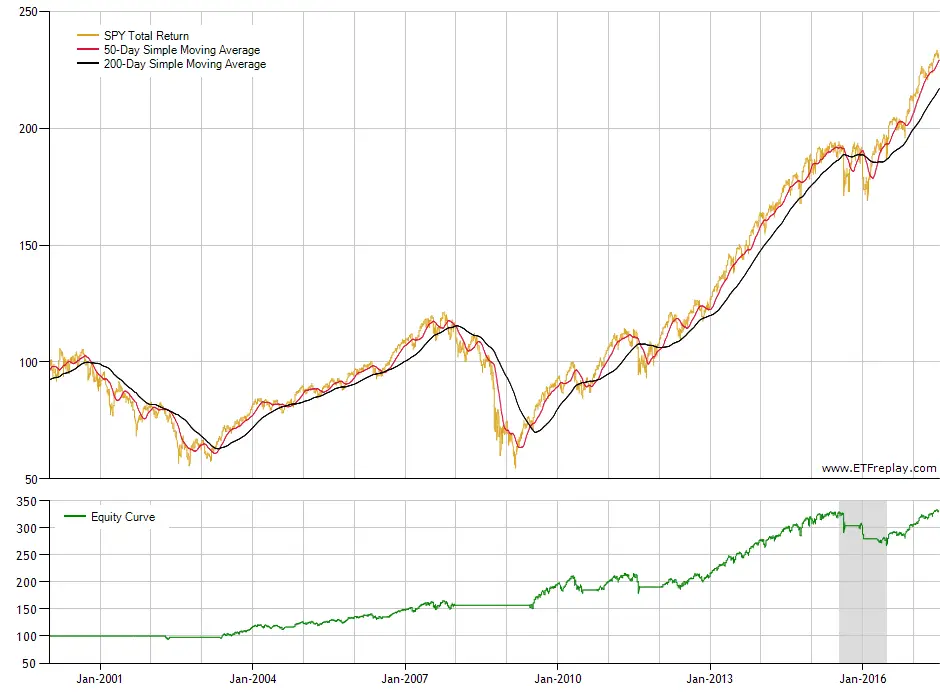
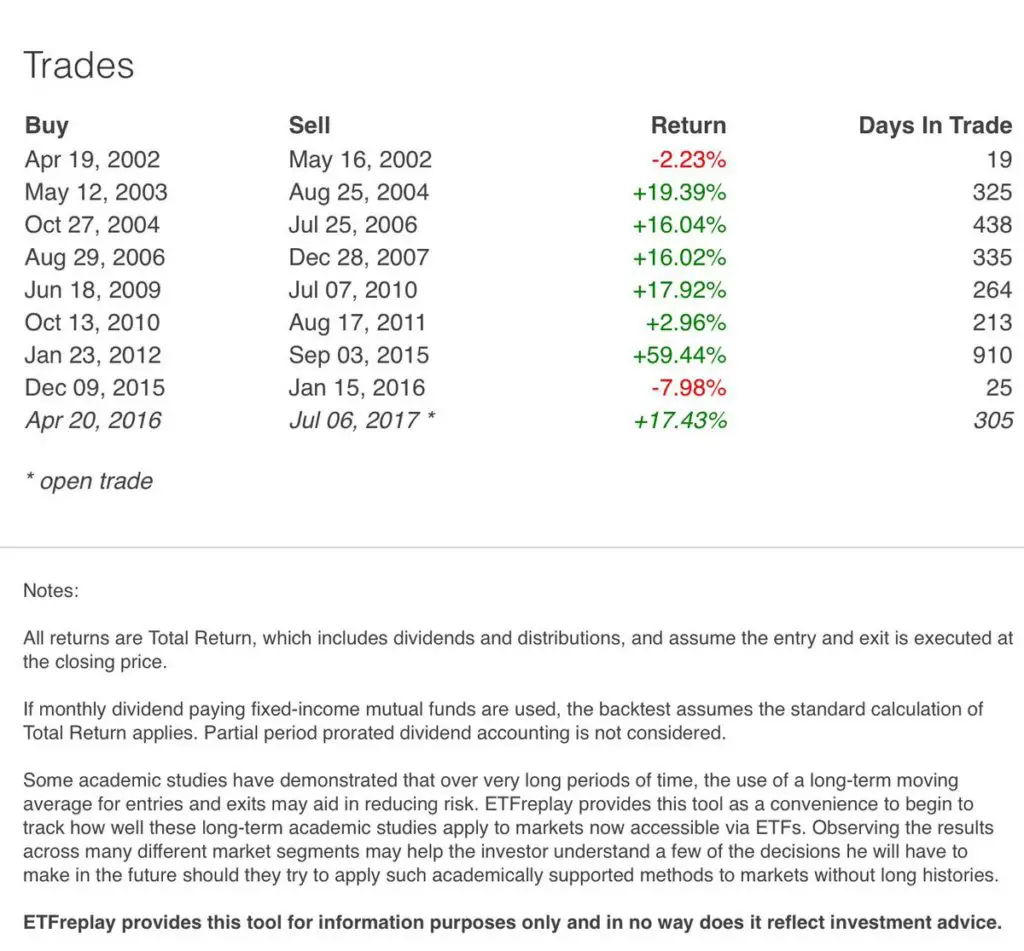
Here is an example of a simple long term profitable trend following system for the $SPY ETF. This is really best compared with buy and hold investing and presents a simple alternate that creates more returns that buy and hold investing and cuts the draw down in capital by over half. It keeps you in bull markets and takes you to cash during bear markets. This is back test data from trading the popular “Golden Cross” that is the 50 day / 200 day simple moving average crossover in $SPY from 2000-2017. The signals are rare but the wining percentage is high at 77% and the wins are big.


For more moving average crossover systems check out my books:
7 Moving Average Signals for Trading QQQ through Tech Booms and Busts
5 Moving Average Signals That Beat Buy and Hold: Back tested Stock Market Signals