This is a Guest Post by: Colibri Trader @priceinaction. This article is used here with permission and originally appeared here on ColibriTrader.com.
How to Trade with Heiken Ashi Candles
While I purely trade price action setups, trading with Heiken Ashi candles looks beyond interesting. Because of the way this indicator is constructed, traders have an insight into past prices projected to current levels.
How come? And what is Heiken Ashi?
Before anything, it is a candlesticks strategy. Nowadays, all trading platforms offer candlestick charts.
Candlesticks have been introduced to the Western world by Steve Nison. His book, Japanese Candlestick Charting Techniques presented a new approach to technical analysis. The Japanese approach.
History tells us candlestick charts appeared in the 18th century, in Japan. A rice trader used them to forecast prices.
By the time Nison presented them to the West, they were quickly embraced. It is no wonder, as the Japanese candlestick techniques are powerful patterns.
Mostly, Japanese candlestick patterns show reversal conditions. That is, after a bullish trend, the market forms a candle, or a group of candles, that show bears trying to take control.
Or bulls, if the trend is bearish. Rarely you’ll find a Japanese candlestick pattern to help traders ride a trend. Unless, there is a retracement towards a previous major level and a price action confirmation.
Check out how to trade with the trend HERE.
But, let’s come back to where Heiken Ashi steps in. It is not a Japanese reversal pattern. But one of the most powerful setups to ride trends.
Defining the Heiken Ashi
Like many others, Heiken Ashi is a charting technique. Or, an indicator.
All trading platforms offer it. The MetaTrader 4, the most popular platform for retail traders, offer it under the Custom indicators.
As the MetaTrader suggests, Heiken Ashi is an indicator. More exactly, it is an indicator applied directly on candles.
It changes the current, regular candles, with new ones. The Heiken Ashi price bars are averaged using a specific formula.
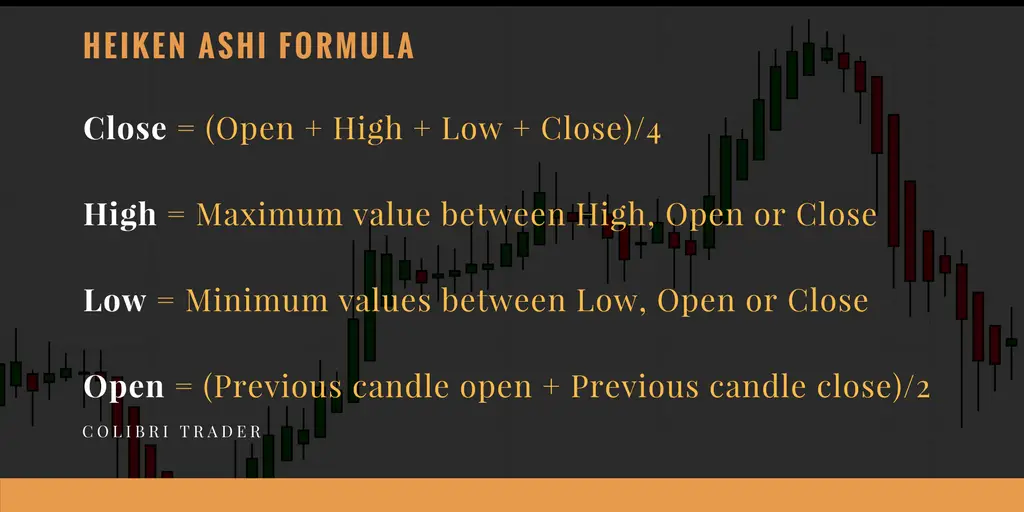
As such, the high, low, closing and opening prices won’t be the same. Here’s the formula Heiken Ashi indicator uses to calculate the four prices mentioned earlier:
Close = (Open + High + Low + Close)/4
High = Maximum value between High, Open or Close
Low = Minimum values between Low, Open or Close
Open = (Previous candle open + Previous candle close)/2

Curious to see what it does to a regular candlestick chart? Let’s find out.
Below is the recent EURUSD four-hour candlestick chart.
And here’s how it looks with the Heiken Ashi indicator.
The red and blue colors were used to show the shadow and body of bears, respectively bull candles. Now that we know what Heiken Ashi candles represent, how to trade with them?
How to Use a Heiken Ashi Chart
The idea of a Heiken Ashi chart is that it filters the noise. Because the Heiken Ashi candlesticks are the result of averaging prices, the candles will have smaller shadows than a regular candlestick chart.
Other differences exist between a regular candlestick chart and a Heiken Ashi one. For instance, there are no visible gaps on Heiken Ashi charts. That’s the result of averaging prices.
But, like on a classic candlestick chart, the shadows play an important role. We all know the rule of thumb here:
NB: the smaller the shadow, the stronger the trend.
The same in the case of a Heiken Ashi chart. A strong candle with a very small or no shadow shows strong trending conditions.
However, because of averaging, the trend is even stronger. Hence:
Important: Heiken Ashi works best in identifying strong trends.
Take the EURUSD chart above. The pair moved in a strong bullish trend since the French Presidential elections earlier this year.
Check the blue candles. Or, their lower shadows. They have none!
Entry and Exit with Heiken Ashi
Because the way a Heiken Ashi is built, trading trends has never been easier. Because of the averages, the pullbacks in a trend are easy to spot using simple trend lines.
As such, simply draw a trend line highlighting the pullback in a trend. By the moment the price breaks it, by presumption traders go long.
The lower shadow gives indication of where to place a stop. Just pick the minimum value in the pullback.
As for the take profit, this can have either a predetermined value or a target derived from a risk-reward ratio. Usually, this could be a major support/resistance level.
A realistic risk-reward ratio for the Forex market is anywhere between 1:2 and 1:3. That means for every pip risked, the expectation is to make at least two or two and a half in profit. As you have seen from professional trading strategy, when scaling-in, you can reach much higher ratios.
All six trades shown above ended in profit with a 1:2 risk-reward ratio. Not bad for riding a trend, isn’t it?
Trend Reversals with Heiken Ashi
As mentioned earlier, the Heiken Ashi indicator is great for riding trends. Not for picking up reversals.
For this, classical Japanese candlestick patterns will do the trick. However, Heiken Ashi does show some unusual activity around a top or a bottom, as well.
In a bullish trend, suddenly, the candles will have larger upper shadows. This shows hesitation. The trend loses its strength.
The gray area in the earlier EURUSD chart shows exactly that. It is no wonder that the main trendline gets broken shortly after.
Conclusion
Traders love using the Heiken Ashi because of the powerful setups it offers. When combined with strong discipline and money management, the resulting trades might be quite amazing.
The biggest advantage of using this type of charts is the smoothing appearance. Noise indeed seems to be filtered.
As a result, traders are left with the true move the market makes. There’s little room for error.
Just use the same principle for the EURUSD move that followed the main trend line’s break. The resulting two short trades end up in profit too.
As always, managing risk is the most important part. If trades are the result of a disciplined approach, the trading account will grow.
Any trading setup will simply not work if it isn’t part of a sound money management system. Traders must know the way out of a trade, before getting in.
That’s exactly what Heiken Ashi offers. A disciplined approach to trading.
One that incorporates a nice risk-reward setup. And, one that has a high winning percentage rate. What more can a retail trader ask for?
Final Words: I do not like to jump from one system to another, so I hope you understand this article’s point is to just show you another trading angle. Stick to what works for you! Filter the rest of the noise like a Heiken Ashi Candle!
For more articles by Colibri Trader check him out here on ColibriTrader.com and follow him on twitter @Priceinaction.


