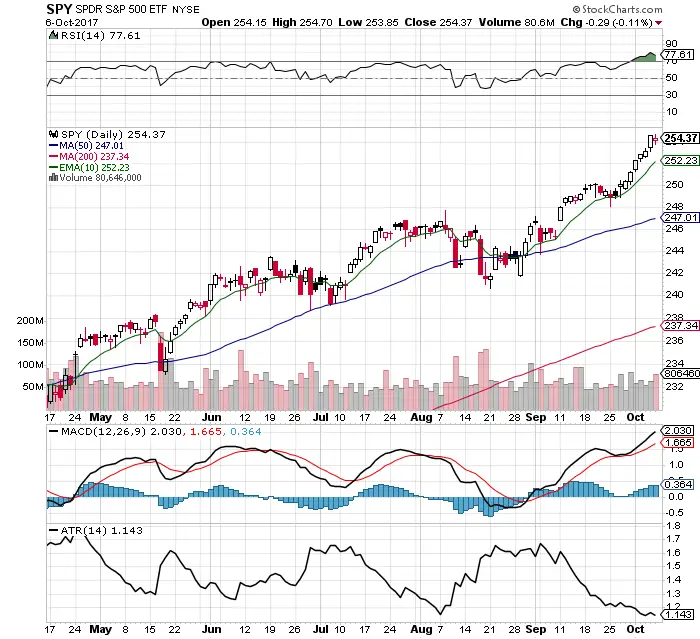
- $SPY is currently under all bull signals.
- $SPY has had six trading days of higher highs and higher lows, this is what an up trend looks like.
- The market has trended higher on good volume.
- Price is above all key moving averages.
- $SPY is near all time highs.
- RSI is parabolic with a 77.61 overbought reading. Over 70 RSI has been a momentum signal since the U.S. presidential election, this is very unusual behavior for indexes historically to remain so overbought for so long but is the current pattern.
- MACD remains in a bullish crossover.
- The average trading range continues to trend lower now at 1.14 ATR.
- The $VIX remains historically low at 9.65.
- Stocks as an asset class are currently under accumulation and there is currently no reason to sell short or expect a correction or crash until there are bearish signals.
I am still long $UWM $ERX $QQQ and recently $SHOP at $97.35.