Chart courtesy of StockCharts.com
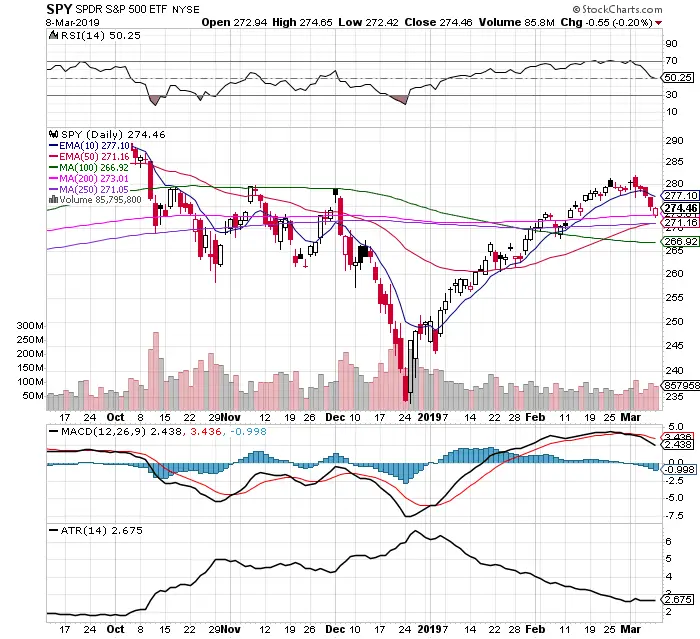
- The chart had a bearish engulfing candle on Monday signaling the swing lower.
- The resistance at $279.59 on November 8th held as end of day resistance with the confluence of the overbought 70 RSI.
- Prices on Friday were the same as on February 5th showing the market has gone nowhere for a month.
- The last three trading days last week were lower higher and lower lows showing a clear swing lower for price.
- The trading range quit declining with the ATR going sideways at 2.65 last week.
- The MACD continues under its bearish crossunder.
- The RSI remains on the right side of the chart at 50.25.
- The $VIX continues to have end of day resistance at the 200 day SMA on its own chart.
- $SPY bounced at its 200 day SMA on Friday.
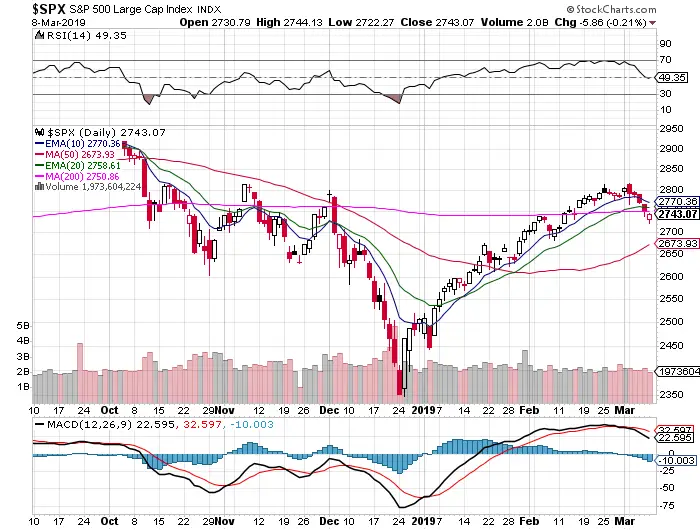
- (The $SPX S&P 500 Index chart has the 200 day SMA as resistance and is under the 50 RSI in contrast to the $SPY ETF chart holding up at these levels Friday. Not a good sign for bulls).
