This is a Guest Post by Niclas Hummel, creator of the Risk Simulator and a trader living in Bangkok.
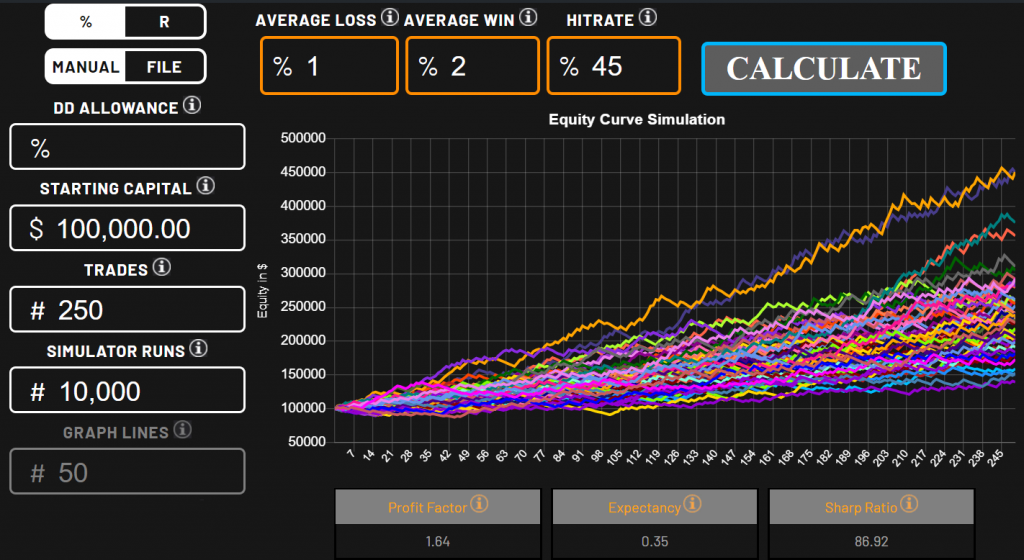
A Monte Carlo simulation projects your trading system’s equity curve into the future. You only have to know the average loss, average win and hit rate of your system.
Because I could not find a good Monte Carlo simulation tool on the internet, I created my own Risk Simulator and made it free for everyone.

The simulation can get you a realistic sense of the inherent risks in your trading system. It shows what you can expect on average in percentages or R Multiples.
Hint: If you have recorded a significant amount of trades (~70) from your trading system, you can use this information as input to use your own trading history and let the simulator calculate hit rate, weighted average win/loss and standard deviations of wins/losses of your system automatically as a basis of the monte carlo simulation.

Looking at the cumulative probabilities of drawdown and returns you can know what to expect on average from your trading system and how high the probabilities of each outcome are.
The return distribution shows you how much your winning or losing trades are bouncing around, based on standard deviation.
That’s not all, there’s more to it.
Expected Drawdown
Different to the highest relative drawdown, this is the drawdown you can expect to have some day in the future. It has a 1% probability of occuring when taking a certain number of trades.
Profit Factor / Expectancy / Sharp Ratio
These numbers show you how well your system is managing risk. On top of that, it lets you compare different trading systems with each other. Higher readings are better.
The sharp ratio makes it possible to compare your return, relative to the volatility of your system, to benchmarks such as bonds or stock indices.
Drawdown Allowance
In the “DD Allowance” field of the Risk Simulator you can specify which drawdown you accept as the highest drawdown. If you run the simulation again, it will show you suggestions on how to not reach this drawdown.
Absolute Drawdown
An absolute drawdown is the drawdown directly counting from the starting capital.
There’s a highest absolute drawdown from all simulation runs and an average one. Why is the average absolute drawdown so low? This is because the chance of reaching your highest drawdown directly in the beginning is relatively low.
Consider the fact that more trades lead to a higher probability of your maximum drawdown occuring.
How does a Risk Simulation help you?
The statistics can’t lie. A Risk Simulation helps you to understand the statistics of any trading strategy.
Knowing the expected drawdowns can help you to find the correct position size for your trading system. A position size that makes it highly improbable to get in a drawdown, that kills your profitability.
On the other hand, knowing what you can probably expect from your trading style can stop too much “hopping around and style drift”. It defines how much capital you actually need to reach your goals while keeping the risk aligned with reality.
Niclas Hummel teaches traders how to understand risk on a professional level. He created the Risk Simulator to give the trading community a tool, that is useful for anyone who uses a trading system.
If you want to improve your risk management skills and learn more about trading. Visit his courses or read articles in his blog section.
