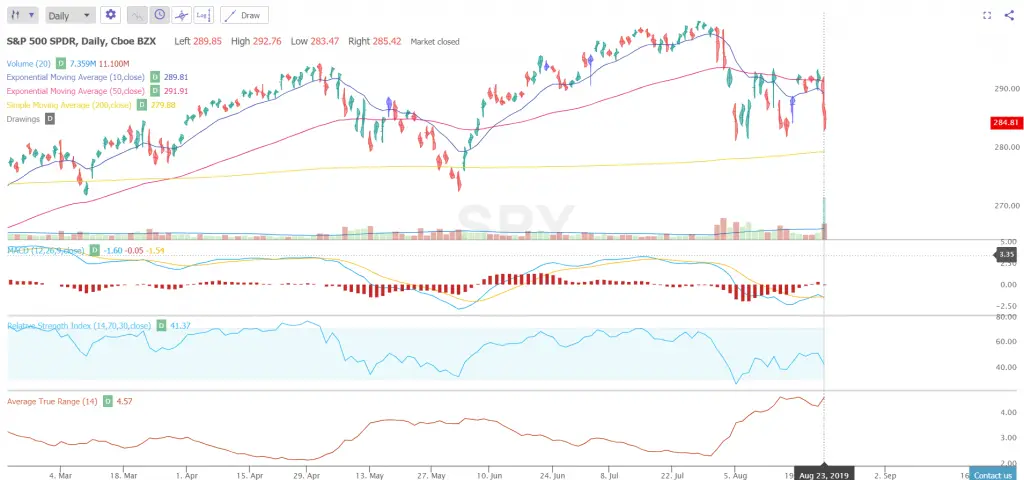
- The current chart is currently driven by headline risk but does have technical levels to watch.
- $SPY price remains over the 200 day moving average. This moving average is a long term bullish trend signal.
- The 10 day moving average crossed under the 50 day moving average this is a bearish signal in the short term.
- The current key resistance on the chart is the 50 day moving average as price has closed below this line for the past 11 days.
- The current price trading range is resistance at $294 and support of $282. $SPY is currently making higher lows.
- The Relative Strength Index (RSI) is currently at 41.37 and can still drop to 30 before becoming over sold. The 30 RSI zone is a historically high probability bounce zone.
- The MACD currently has a slight bearish cross under showing the loss of momentum to the upside over the past three weeks.
- The Average True Range (ATR) at 4.57 broke to a new short term high Friday and is the highest it has been since January of this year. This is the widest trading range in the past 7 months.
- The down day on Friday was on the highest volume of the week.
- I will be looking to buy the dip if the 30 RSI area holds as support or buy the momentum signal when the 10 day EMA closes over the 50 day EMA using $SSO for leverage.

Chart courtesy of TrendSpider.com