Candlestick Charts Cheat Sheet

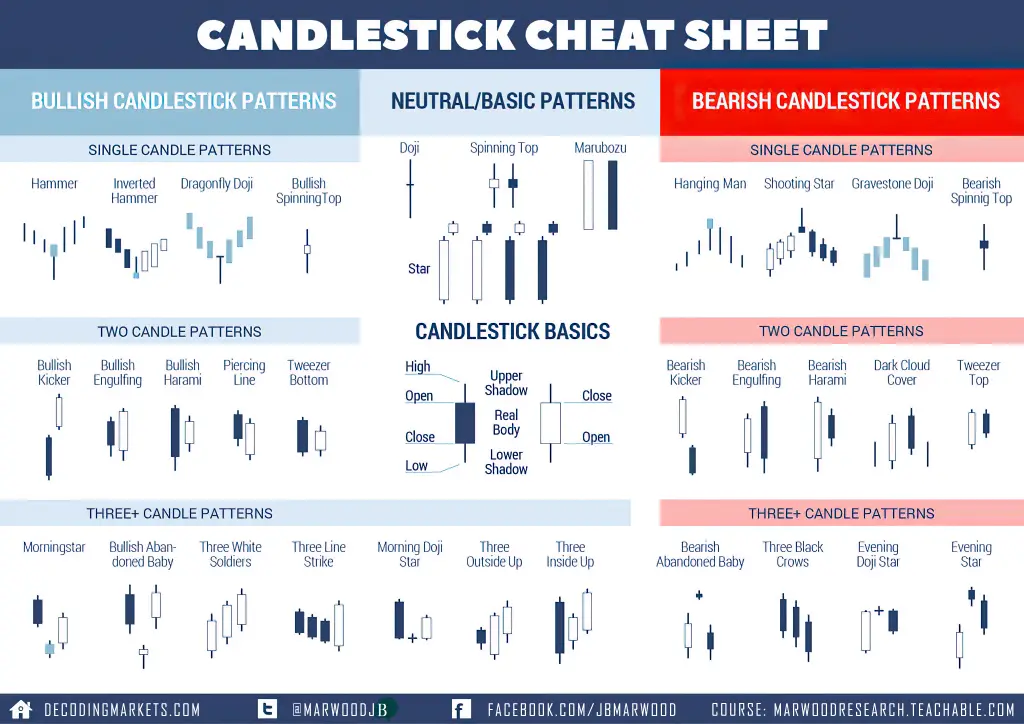
Candlestick Charts: The ULTIMATE beginners guide to reading a candlestick chart

Candlesticks are a type of chart setting available on trading platforms that creates a visually representation of price action on a time period. A candlestick shows a contrast between the opening and closing prices along with any range outside the open or close. They are colored to show bullish or bearish action. The three primary

Candlestick Charts: The ULTIMATE beginners guide to reading a candlestick chart Read More »

Best moving average crossover signals

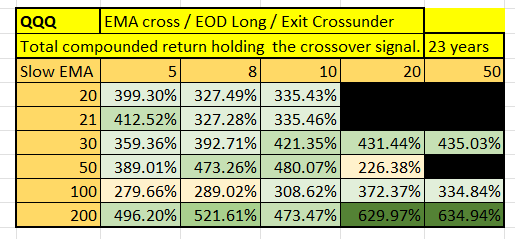
BEST Moving Averages for Crossover Trading Strategies

Moving averages are technical trading tools that can help identify trends on different time frames. They can replace opinions and predictions for making trading decisions by being used as signals. Moving averages can identify trends and swings in price action in real time also signal range bound markets when they go flat with no directional

BEST Moving Averages for Crossover Trading Strategies Read More »