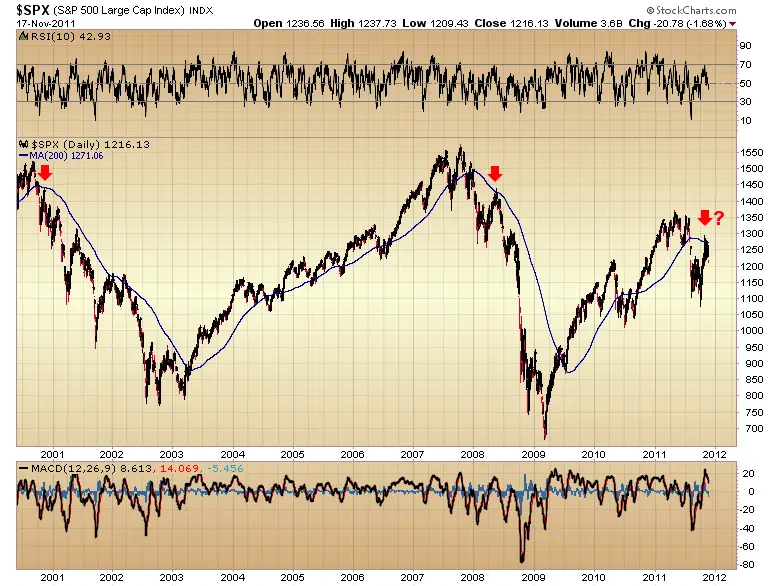
The 200 day is the test of all tests for the bulls, there are many systems used by traders that gives a buy signal for stocks as they move above their 200 day moving average. For the last three years buying THE market leader Apple as it either bounced near or rallied back above the 200 day moving average was the best entry point to go long. The green line below is the 200 day moving average.
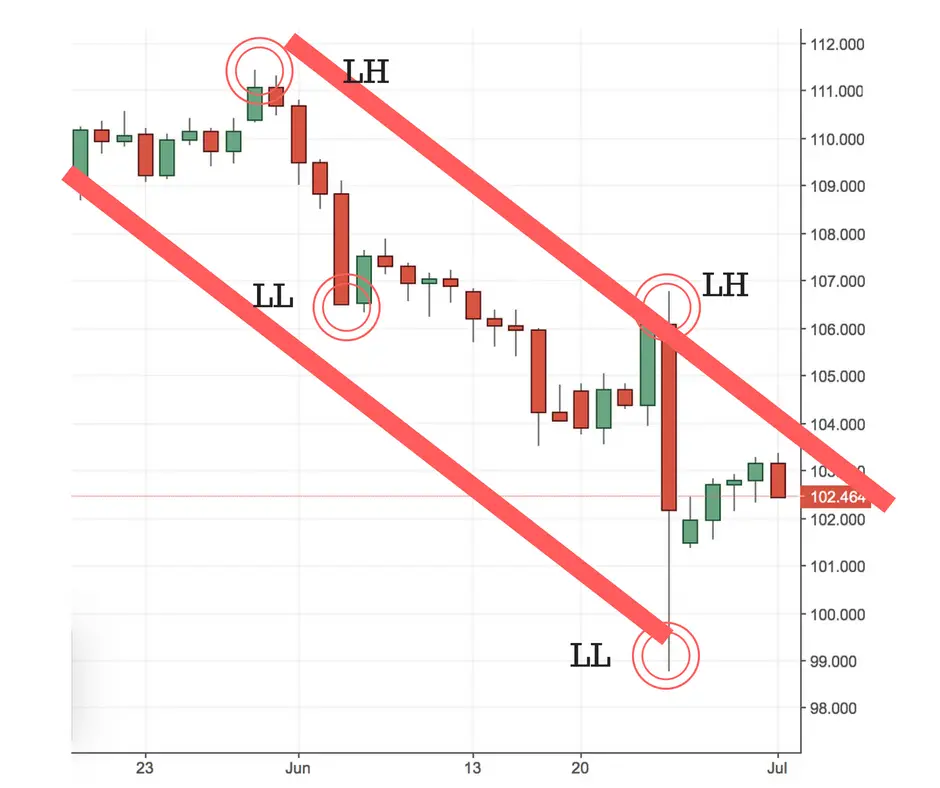
At the same time when a fallen leader loses the 200 day it is a huge sell signal and is a great opportunity to go short. With multiple losses of the 200 day and it failing to hold as support it is usually a fatal result for the stock price.
Above the 200 day moving average there are many support levels at key moving averages the 5/10/20/50 and the 100 day. Below that line we are just fishing for support, that is when past price levels come into play from years ago, horizontal trend lines even start having meaning . Under the 200 day is a VERY dangerous place for a stock to be, for an index to go there we are a the crossroads between the bull and bear market. If we can get a bounce at that line and if it can hold as support for multiple days then we may have a buying opportunity but with small positions and risk controls. Maybe. Below it and I will not take longs until the stocks like AAPL bounce off their 200 days. If we lose the 200 day in the $SPY I will continue to do what I am doing now short old leaders like $PCLN, failed IPOs like $FB and junk stocks like $RIMM. We will be in no man’s land fighting to get the buying power to take us back above the 200 day, the problem will then be the selling at the 200 day and it becoming the new resistance if the European fiasco continues.

We have come to the crossroads…stay tuned.
