-
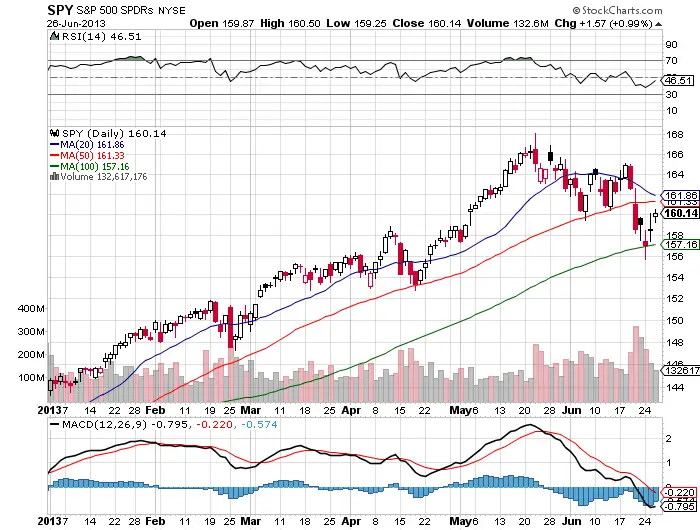
For the past 5 trading days we have been in a range bound market.
-
The 100 day is the logical support line in this current price range with a quick reversal back over it the first day it was lost and bounce off it the following day.
-
The 50 day is the resistance area, 5 days ago we were able to rally above it after opening below it but that rally was quickly rejected and we have been below since.
-
Look for us to test the 50 day tomorrow, the odds are that we will be rejected at that level, the buyers that bought that old support level will likely want out to get out when they are back to even the first chance they get. The old support usually becomes the new resistance.
-
It will be important to trade much smaller than usual in this market due to the volatility and wide trading ranges.
-
The 20 day is starting to slope downward showing that lower highs and lower lows in the past 20 days is leading to this market being in a short term down trend.
-
This is not the market we enjoyed in the first half of the year, trading under the 50 day leans the market toward a downtrend now not the over whelming up trend we enjoyed until the middle of May. We now have to work for our profits we can’t just buy the dip, because now a dip can turn into a double dip.
