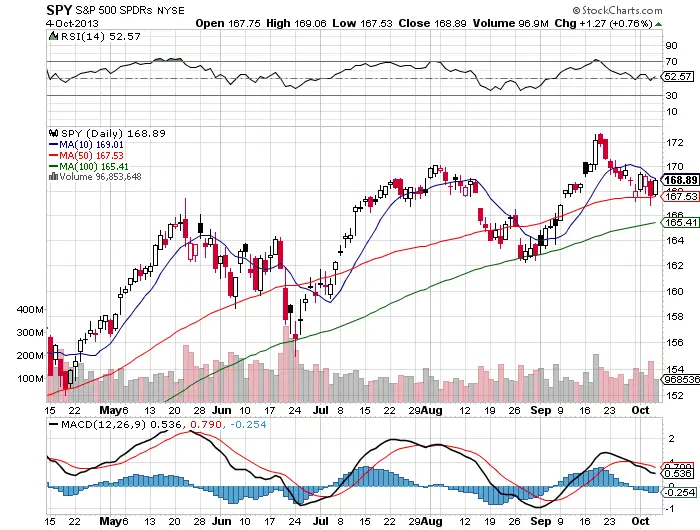
The market is either at the top of its near term range or at the edge of breaking out to a new price range. Crossroads here, here is what I see and will be looking at this week in the markets. I am currently risk off and neutral here as the politicians play ring around the rosy but when I get my signal I can flip long or short quickly and size appropriately to take advantage of where we go next. I will be watching closely for where we close each day and how much volatility expands. There are not a lot of reasons to be bearish here as the market is holding up well along with leading stocks and hard to get really big and bullish in most areas because we are at the top of a nice run in equities and settling into a range here.
-
For nine trading days the 10 day SMA has been resistance and each day SPY has closed below this level.
-
For 20 days the 50 day SMA has been support and SPY has always rallied back over the 50 day before the close in the 20 day time frame.
-
Currently the SPY is range bound, I am waiting for a break and close above the 10 day or a loss and close below the 50 day.
-
I expect that when the general market does decide its next trend that it will be a strong move out of the congestion area.
-
Currently the majority of traders are waiting on a resolution to the U.S. government shut down. The majority seem to expect a strong rally on the news of a compromise.
-
Big caps (DIA) are in a down trend and showing weakness.
-
Small caps (IWM) and Tech (QQQ) are near highs and trading in healthy price ranges.
-
Leading stocks all still acting well and in price bases. $TSLA $FB and $PCLN
-
When the SPY breaks out and trends it could quickly revisit all time highs or the 100 day again.
-
I am not predicting here, I am open minded and will take the break out and close whichever way it goes. My position size will be based on the power and strength of the move. Rising volatility will cause me to lean more bearish while a gap above the 10 day that holds near the high of the day will make me bullish.
