-
For most traders volatility is harder to trade profitably than trends and chart patterns, this is a time most traders should be in cash and waiting for a set up or trend to develop. The daily gyrations if watched all day can really mess new traders up.
-
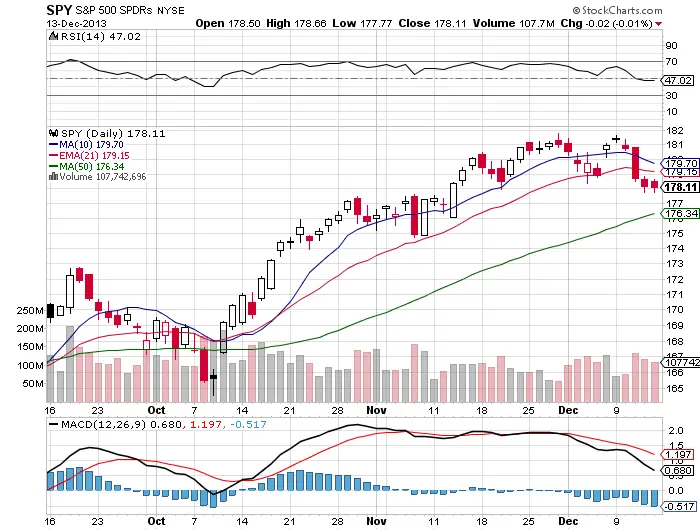
The plunge below the 21 day ema on Wednesday signaled a change in the market bullish dynamics in the short term because it was not recovered from the next two days. I will be waiting for a bounce or reversal candlestick at a key level.
-
$SPY has gotten very extended from the 10 day sma and like a rubber band that is stretched it will eventually touch it sooner than later.
-
For 21 trading days the $SPY has been inside a $178 support $181.75 resistance trading range. A break of one of these areas could be the signal of the next leg of this trend. Currently $SPY is in a short term trading range and a long term up trend.
-
The 50 day sma is the key support area to watch, a close below that level could open up the downside to the 100 day and 200 day moving averages as the next support.
-
This year the 40 RSI has been a major signal to go long. That is the level to watch for a bounce and a dangerous level to be shorting into the hole.
-
Shorts need to be aware that buy the dip players could rush in at anytime and takes us back to new all time highs. If we get to the 50 day is the first dangerous area to be short.
-
The VIX is expanding and that is not a good sign for longs we need to let the volatility settle down before any full size long positions are taken.
-
This is still a bull market and buying supports and bounces have better odds of profits than shorting.
-
I still have a bias long in this market just waiting for a signal here to get long again when the dust settles I am currently flat. I would consider going short only after the bullish market dynamics change.
