-
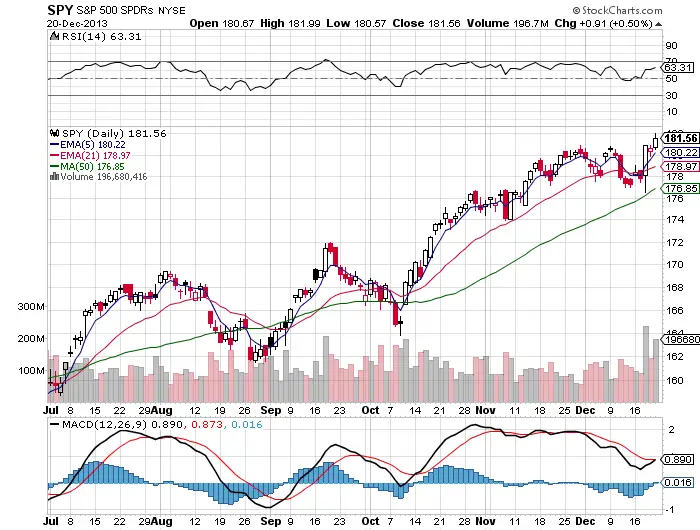
The 50 day sma bounce that most traders expected did happen Wednesday and it was fast and furious moving from the near term support back to resistance in a manner of hours. There really was no choice but to go long with that massive reversal candlestick, the bulls won.
-
We now have two days of the 5 day ema acting as support which is very bullish.
-
All time highs is my favorite place to be long, everybody is profitable and there is no selling pressure at these levels just profit taking.
-
We need a slow grind up to keep from getting too overbought too fast.
-
Swing traders can look to take profits if the trend starts stalling out at the 70 RSI level. That has been a ceiling all year and stopped all parabolic moves higher.
-
The next logical target for me is the $185.00 level.
-
$SPY just got an MACD crossover buy signal Friday as well with some room to run up.
-
Seasonally this is a low volume time of year with a half day of trading on Tuesday and the market closed on Wednesday, many professional money managers will be out this week on vacation and this could lead to some strong moves with little resistance.
-
Seasonally the odds favor a “Santa Claus” rally into year end.
-
Friday was a break out to new all time highs, support should be at the previous all time high to maintain this new price level of higher highs and higher lows.
-
The volume entering equities through the $SPY is incredible some of the highest volume days of the year on Wednesday and Friday of last week.
-
The pressure next week will be on those that missed the 50 day bounce and the break out to chase and buy here and also on the shorts to cover, the holders of the $SPY going into this week have no pressure to sell and this could take us higher as a ticket to get on the bull bus starts to get more expensive because the trend riders don’t want to give up their current seat.
We’ll see.
