-
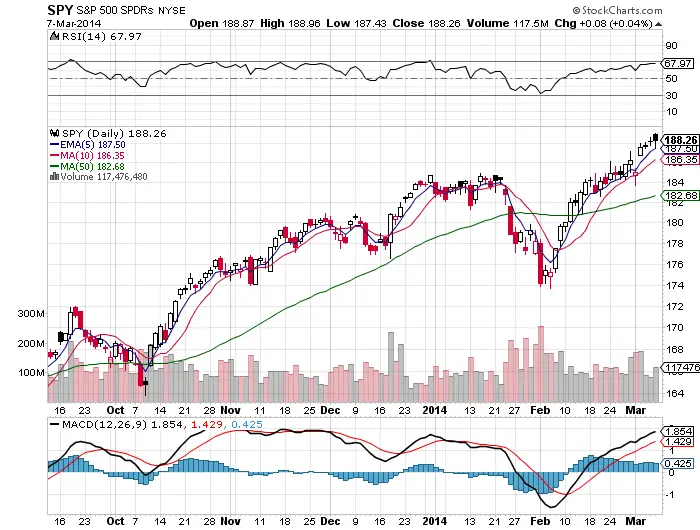
The 70 RSI level is the intra-day resistance here. $190 $SPY will also likely be a key resistance if we get there.
-
Above the $SPY $190 or 70 RSI we would be parabolic but the odds are against it.
-
The risk/reward is in favor of the downside but momentum after the gap favors a grind sideways consolidation for awhile.
-
A close under the 10 day sma is the signal that bears may get the upper hand to get some kind of a correction.
-
The 5 day ema has been the end-of-day support 19 of the past 20 trading days.
-
The end of day support at the 10 day sma has held for 20 days and only breached once intra-day in that time period.
-
The equities market really does not care what Putin does with Crimea so far.
-
The Crimean stand off led to a very bullish gap and go after Putin backed down just a little.
-
The momentum in this market has been incredible bullish after the $174 bounce, no signs of cracking at this point.
-
The non-farm payrolls report gap up was sold, but it was only profit taking we still closed green as dip buyers stepped in at the 5 day ema.
