2014 has turned out to be the year where we find out which stock traders and investors are great at exiting with a profit and swing trading and which ones were just lucky in 2013. The darling momentum stocks of 2013 are being sold into strength every chance they get. The buy and holders that were rewarded for doing nothing in 2013 are being punished with little to no profits but lots of swings in their equity. The new know-it-alls on social media are getting more quiet as it is not as easy to just buy the dip and wait to be bailed out of a losing position. The after earnings gap and gos are turning into gap and craps as it is now an opportunity to unload holding not accumulate new ones. This is a time for risk management and having robust signals to trade not being a cowboy or a hero. Reality is slowly returning to the stock market, so we all need to accept the reality of what is happening and not try to trade like it’s 2013.
-
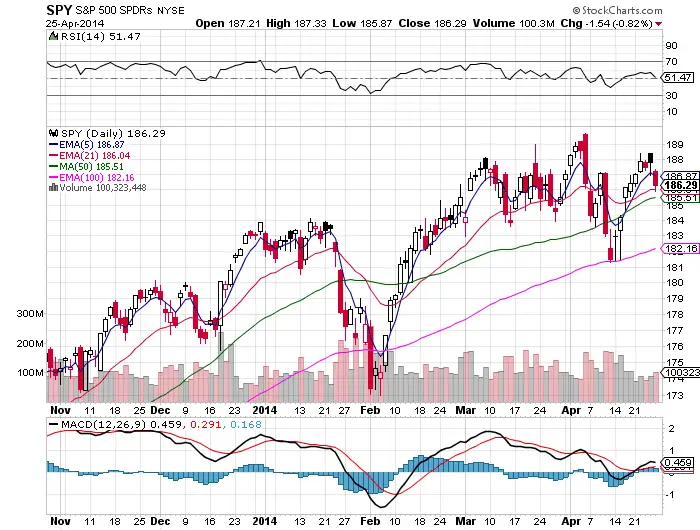
The long term up trend is still in place for the S&P 500 equity index and it is still within striking distance of all time highs.
-
The intermediate term trend is range bound with trading off support and resistance profitable.
-
We are in danger of a short term down trend with the failure of the gap up Thursday with the solid black ‘failure’ candlestick. Stock charts indicates a trading day that opens above the previous days closing price but closes lower than the open the same day in solid black. I call this a “failure candlestick”. The majority of the time the black candlestick proceeds a short term sell off to the downside. It is a clue of a lack of buyers at a higher price level.
-
The S&P 500 has not sold off as badly as the $QQQ or $IWM becasue of its weighting in out performing sectors like Energy (about 10%), Consumer staples (about 10%), and Utilities (about 3.5%).
-
The odds here are on a test of another swing low t0 the 100 day ema or 30 RSI area with the failure to climb back to all time highs and a loss of the 5 day ema.
-
Friday $SPY found support at the 21 day ema, next level of support is the 50 day sma, a close below the 50 day sma and odds are lower.
-
Leading stocks in the market are telling the tale of distribution not accumulation of equities. Profit taking may finally lead to a deeper correction this year to set buyers up to buy at levels they are more happy to hold.
-
This market has gone of for a longer time than most ever have with out any kind of real correction.
-
Momentum stocks are just getting clobbered at this point, not healthy for the stock market.
-
Buy and holders of indexes are barely profitable if at all this year a sign that this is not 2013.
