-
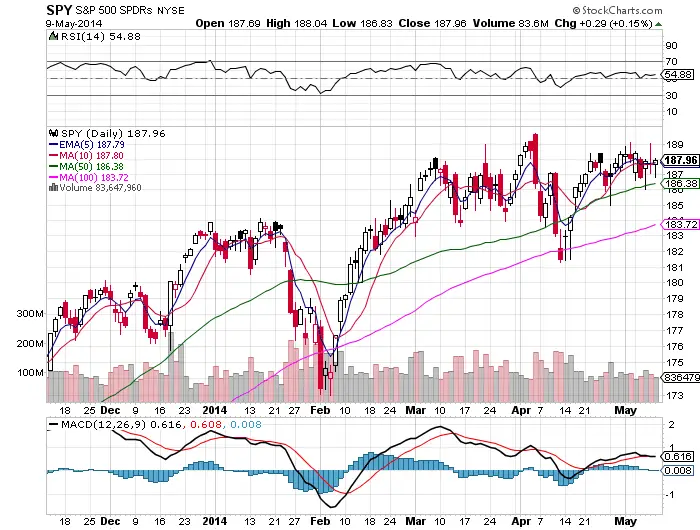
Welcome to the range bound phase of this bull cycle. The S&P 500 has not been able to give up much more than 2% this year for long trend followers and buy and holders in this index. 2014 is the year of being stuck in the mud so far with little I see to change that anytime soon.
-
Swing traders and option premium sellers are the ones that are making money this year taking over the easy money reins from the buy the dippers and buy and holders from 2013.
-
Buying off support at the 50 day has replaced buying the deeper dips to the 100 day in recent weeks.
-
The short term trend indicators of the 5 day ema and the 10 day sma have both flat lined and are currently of little use for trading this index.
-
The up trends have moved to $XLP $XLE and $XLU which are generally late stage bull market sectors.
-
The down trends have moved to most of the old favorite momentum stocks. $TSLA $FB $TWTR $GOOGL etc.
-
$XLF that is usually a market leader in bull phases is having trouble at the 100 day with most banks under their individual 200 days. $JPM $GS
-
What use to be break out signals to buy are quickly turning into set ups to short across most equity sectors and indexes.
-
The long term up trend in equities is currently rolling over into a range-bound market as the intermediate trend is now range bound. 17 trading days of $185 support and $189 resistance for $SPY as it is propped up by late stage sectors still trending up and distribution is many risk on sectors and momentum names.
-
This is not a great time to be holding a portfolio of stocks this is a traders market. Short term time frames are where the current profits are being made except for some key short positions with wide stops to let them breathe.
This is a market to trade smaller in with shorter time frame and smaller positions sizes.
