I am flat coming into today. No positions.
— Steve Burns (@SJosephBurns) March 25, 2015
- Monday and Tuesday warned me to exit my long positions with a failure to make higher highs and then Tuesday with a close below the previous days low of day. I went to cash on Tuesday.
- The bears put the brakes on the bulls Wednesday and the bulls failed to ever recover.
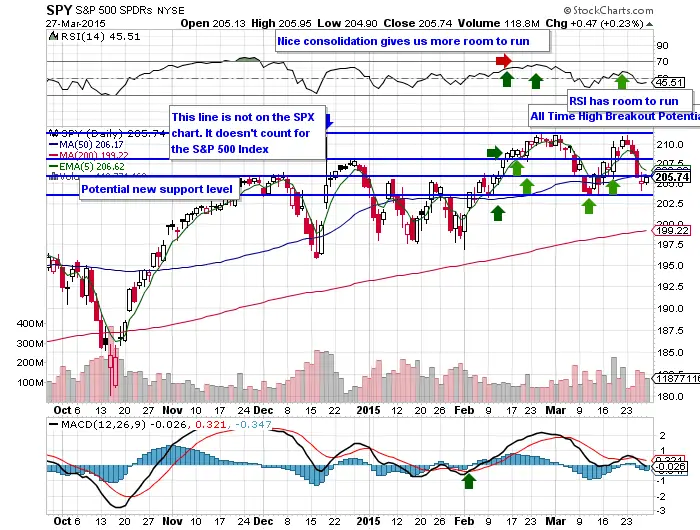
- The violent whipsaw on Wednesday invalidated all the bullish signals and took the RSI, MACD and intermediate moving averages to a short term down trend.
- The $206 breakout from late 2014 has now become resistance here.
- The 5 day ema /10 day sma crossover indicated a short term downtrend.
- $SPY is under all key short term moving averages 5 day ema, 10 day sma, 21 day ema, and the 50 day sma. These will have to be recovered to indicate a short term up trend is holding.
- $SPY failed to ever get back into the Wednesday trading range this is a sign we could see more downside.
- $SPY is now trading under the 50 day and the wrong side of the intermediate moving average for up trends.
- My momentum entry signal is a possible break above the 50 sma if other indicators line up.
- My buy the dip signal would be in the $SPY 30-35 RSI range on the daily chart if we get there.
