Skip to content

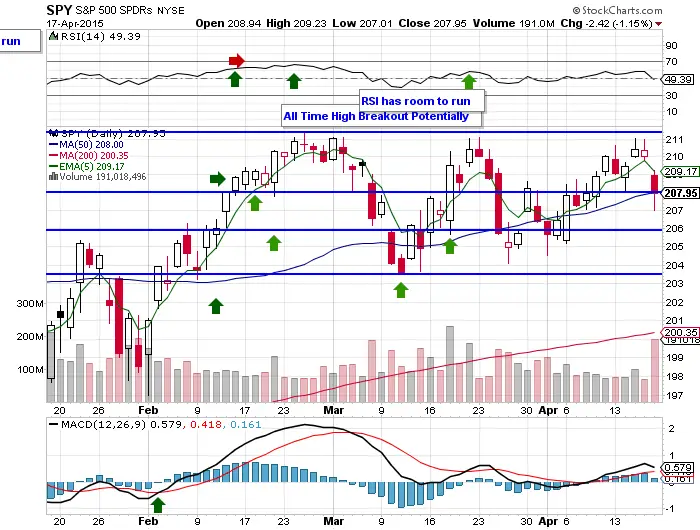
- Currently the $211 price level has held as the $SPY resistance on the daily chart.
- Friday’s resistance was the 5 day ema.
- On Friday the 50 day sma almost held as end of day support.
- For nine days $SPY has traded in a $207 support/ $211 resistance price range.
- With $SPY up only 1.17% for the year big cap U.S. stocks are not under accumulation in 2015.
- The stocks in this index are not being distributed, they are being held and swing and day traded.
- Both the RSI and MACD are very near neutral giving no momentum signals for a trend either way.
- Friday’s down move had twice the normal recent daily volume.
- Greece’s debt default and China’s slowing growth are concerning macro traders leading to some risk off moves.
- With this tight trading range the market currently favors: selling into strength, buying deep dips, and taking profits while they are there.
