Skip to content

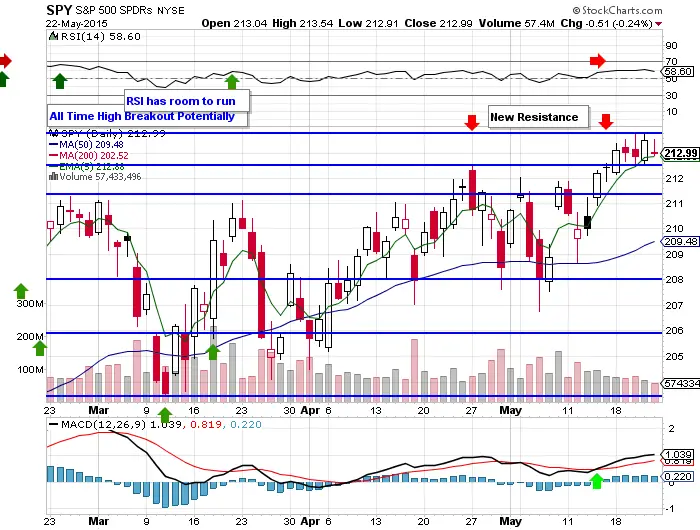
- $SPY’s new resistance is at the all time highs of $213.75.
- The price level support is at $212.50, a close below this level is one sign of the start of a reversal.
- The near term key moving average support is at the 5 day ema, which shows that we have momentum. We have not closed below this line in 6 days.
- The RSI has room to run higher at 58.60, which is bullish.
- The MACD maintains the bullish crossover.
- Many leading stocks are making nice recoveries from oversold conditions. $FB, $AAPL, $BABA, and $GPRO.
- $DIA, $IWM, and $QQQ all confirm bullish strength in the stock market.
- All sector ETFs are currently range-bound, showing trading of equities, and not distribution.
- Stocks as an asset class are still under accumulation, but the velocity of the money inflows has slowed.
- The transportation sector is near oversold levels and nearing a buy point: $IYT.
