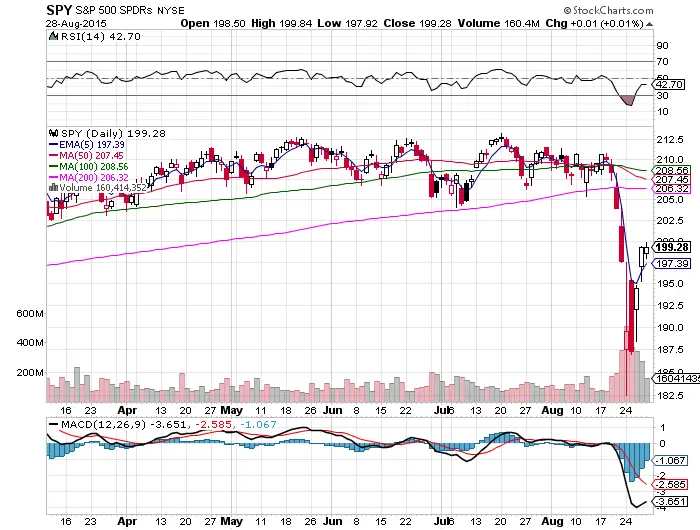
The sell off last week was fast and furious, even compared to 2000 and 2008. Once the $SPY lost the 200 day simple moving average, distribution set in. There was virtually no price recovery as the Dow Jones Industrial Average shed 2,000 points over five trading days. On Wednesday the bounce began. There is a good probability that last week was not the bottom for 2015. This may be the first warning to bulls that markets don’t just go straight up and that pull backs, corrections, and bull markets have not been removed by central banks. You eventually run out of buyers at high price levels and they wait to buy lower. Market cycles still happen, uptrends become downtrends, volatility lives, and bear markets eventually follow bull markets. It is not the end of the world, it’s just supply and demand.
- The stock market is in a downtrend, with price under all key moving averages; the 50 day, 100 day, and 200 day. $SPY is negative for the year.
- My trading model has switched from buying dips to selling strength short.
- $SPY went down on increasing volume for four out of five straight days, then went up on three days of declining volume. This is a sign of distribution.
- The RSI broke the 30 RSI and didn’t recover by the end of the day. This is a parabolic downtrend signal, and extremely rare in any kind of market.
- The MACD is parabolic bearish.
- We now have overhead selling pressure because there are people holding $SPY all the way up to $213, and they will be looking to sell to get back to even when their entry level is reached. This hasn’t been an issue over the past several years, but it will slow down attempted rallies.
- Last Monday injected fear into the market and we could see panic selling during any gap downs or big point moves next week. Many market participants were traumatized by the Monday plunge and Tuesday drop.
- After last week, dip buyers won’t be as confident as they have been after the losses most of them suffered when all key support levels failed.
- The $VIX at 26 is not bullish, it’s dangerous.
- $QQQ is the index ETF closest to breaking over the 200 day. I am currently short $QQQ from the Friday entry at close, but if it can close over the 200 day next week, it would be the first index that I would go long again with that signal. $SPY, $IWM, and $DIA are all broken, and I will be looking to short strength on any big extensions above the 5 day EMA.
