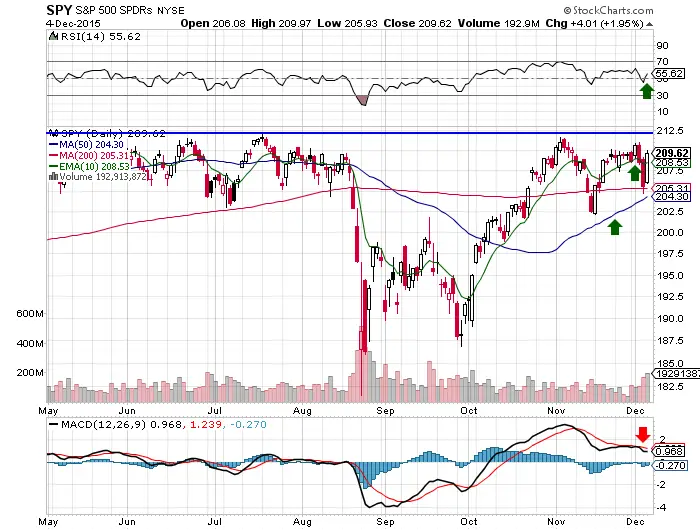
- Very strong bullish daily candlestick on Friday that overtook the Thursday high of day. A bullish candlestick that large leads to higher prices the majority of the time.
- Friday bounced strongly off the 200 day support Friday. The 200 day has gone flat but it is bullishly constructive to be above it.
- The 50 day SMA is ascending to the upside which is bullish.
- $SPY broke back above the 10 day EMA Friday showing momentum to the upside.
- $SPY is up 1.99% year to date and is set up nicely now to go higher into the end of the year.
- The unadjusted resistance level on the daily chart is all time highs at $213.78. The odds are that this is broken before the end of the year. The more times that this level is tested the higher the odds that $SPY breaks out.
- The RSI is bullish at 55.62.
- The MACD is still in a bearish crossover after two failed bullish crossovers. It could crossover bullishly this week with one more strong up day and align with the other indicators.
- The bull market is in tech and world changers $FB $AMZN $NFLX $GOOGL and $MSFT as they are near all time highs. $QQQ 11.52% YTD continues to be the strongest index ETF and $IWM -1.54% YTD the weakest. The overall market is stuck in a range and is being carried by a few stocks. The market as a whole is just being traded not accumulated in 2015. A broader market rally will be needed to take $SPY to all time highs and beyond.
- December is seasonally bullish for stocks and the odds stay on the side of the bulls as long as the 200 day SMA is held as support.
Full disclosure: I am currently long $SPY and $BABA going into Monday morning,
