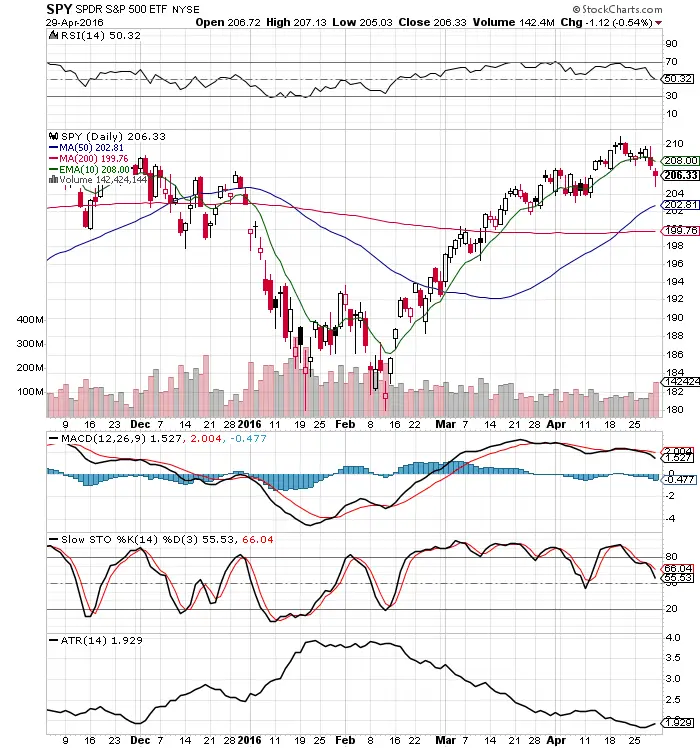
- $SPY failed to break out of all time highs last week.
- $SPY has gone no where for a year back to the same price levels of early 2015.
- $SPY is still holding over the long term the 50 day and the 200 day moving averages.
- RSI is near neutral at 50.32.
- $SPY had a reversal candle Friday near the $204 short term support.
- $SPY went down on Thursday and Friday on increasing volume.
- $SPY lost the 10 day EMA last week.
- MACD has a bearish cross.
- Slow Stochastic is under a bearish cross.
- Average true range is beginning to increase signaling that the trading range could expand.
There is a high probability next week of range bound price action and expanding volatility before we break out to new all time highs.