Skip to content
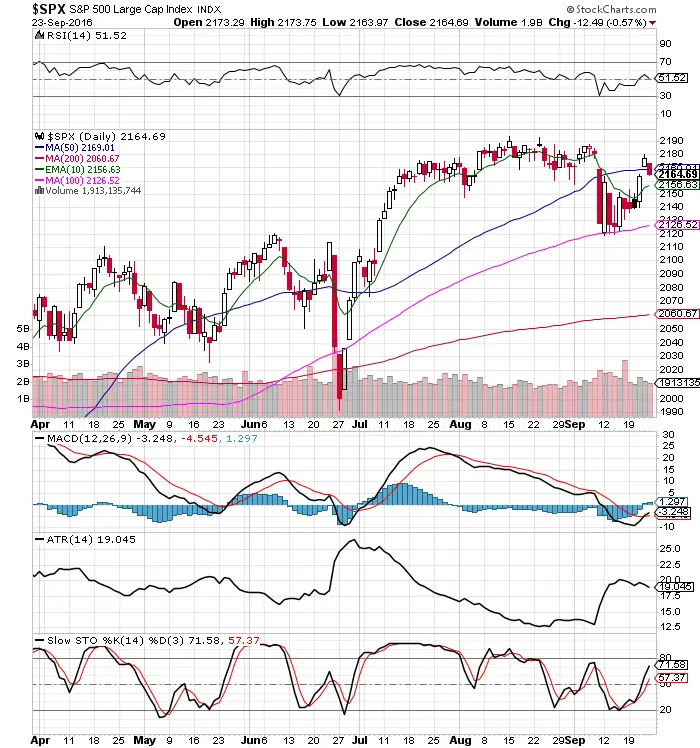
 Chart Courtesy of StockCharts.com
- SPX continues in a range with resistance holding at 2200 and support at 2120.
- SPX new all time highs stays within striking distance and is still possible in coming weeks.
- The SPX 100 day SMA held as key support during the last plunge.
- The SPX MACD finally had its first bullish crossover since June.
- Slow Stochastics maintains a bullish crossover.
- RSI neutral here at 51.52.
- The FED keeping rates steady led to the two day bounce.
- The 50 day SMA did not hold as SPX support on Friday.
- Price got over one ATR extended from the 10 day EMA before the pullback and price could return to the 10 day EMA.
- We stay in a trading range where buying deep dips and selling multiple day rip upwards continue to be rewarded with profits.
