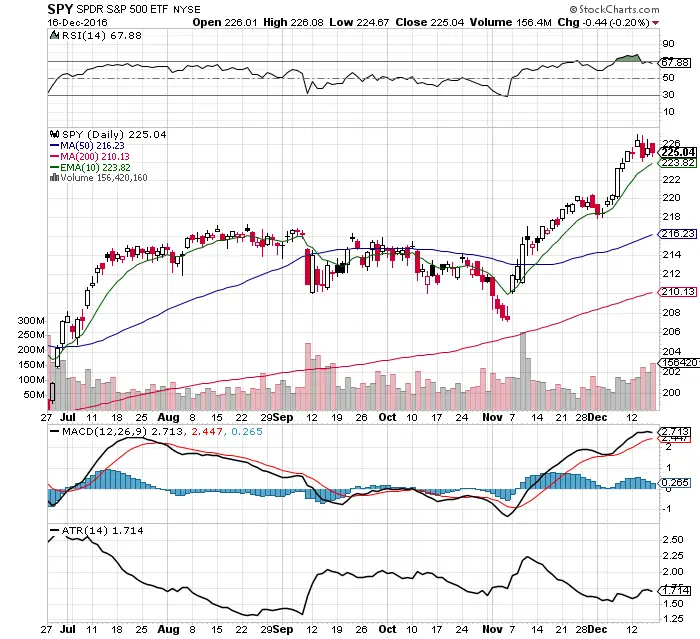
- $SPY continues to stay in a strong uptrend but is starting to consolidate gains.
- $SPY traded in a $224 support and $227 resistance trading range last week.
- Price has become very extended from the 50 day and 200 day SMA and even the 10 day EMA. A small pullback is likely next week to the 10 day EMA.
- RSI still overbought at 67.88 and beginning to reverse out of overbought levels. Not much upside potential here without some price consolidation.
- MACD maintains a bullish crossover but signal line is beginning to reverse.
- A small increase in volatility last week as the ATR increased and the daily trading range expanded.
- The long top candlestick wicks in price action last week are a sign of a rejection by buyers of higher prices.
- $VIX remained flat last week showing little fear at this stage of the market move.
- The $SPY leading sector $XLF has been range bound for over a week. The S&P 500 will need other sectors to strengthen to move this trend to another level higher.
- All stock indexes have gone sideways here and swing trading lows long and selling highs is starting to work again.
I am short $DIA here via $SDOW as the DJIA 20,000 is likely a profit taking area after this amazing run up. I would also be a buyer of a dip in $SPY.