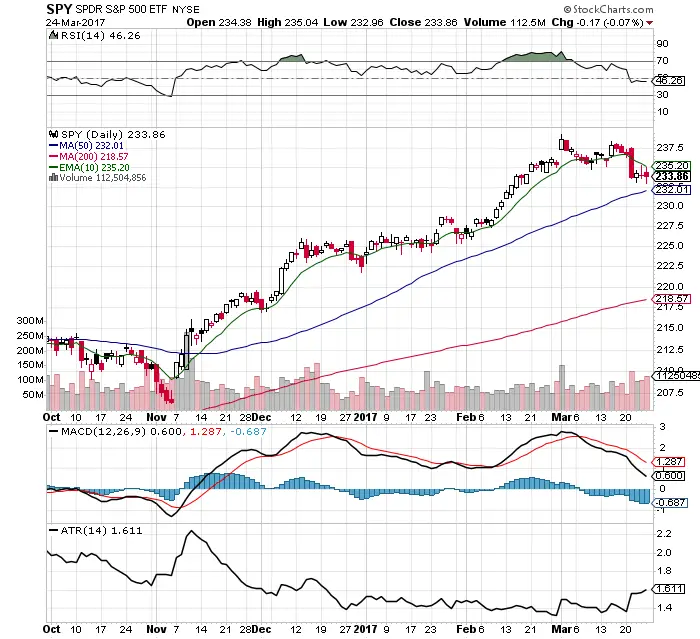
- The long term uptrend is still in place.
- Short term resistance has become the 10 day EMA.
- Short term support is currently the 50 day SMA.
- A break out and close on the other side of one of these levels could signal the next trend up or down.
- RSI finally dropped below the neutral 50 to 46.26. I would be a dip buyer around a 30 RSI.
- The MACD bearish cross took awhile but was confirmed as a warning.
- The downside has not trended. $SPY has stayed inside a new small trading zone. With $233 support and $238 resistance.
- We have lose momentum to the upside for now. However it remains a bullish chart to be so close to new all time highs in price.
- The market has begun to end lower each day than the open showing some profit taking at these levels.
- Volume is picking up on the down days which is a sign of distribution.
I will remain a buyer of dips to support and/or the 30 RSI.