Skip to content
 Chart is Courtesy of StockCharts.com
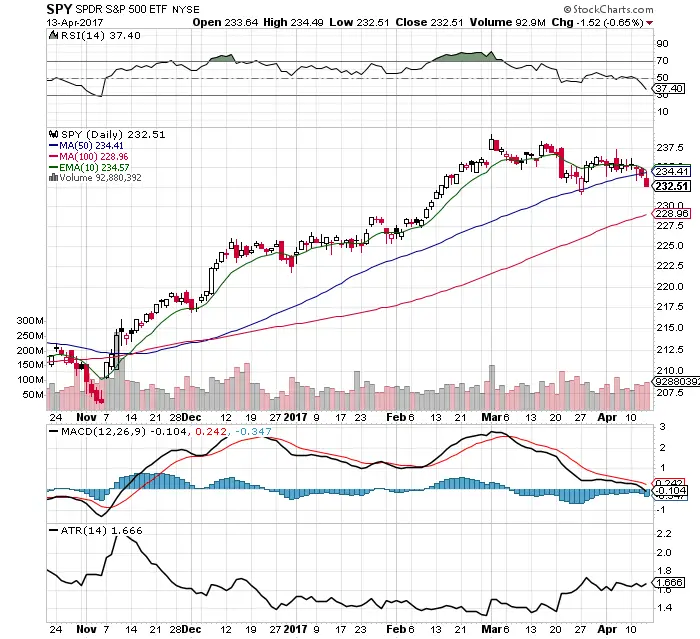
- Long term the trend is still up as $SPY continues to hold far above the 200 day SMA.
- Short term the market is in a range. $23o Support and $240 resistance since February 10, 2017.
- The 50 day SMA was breached for the first time since the presidential election results.
- For the past 9 days the 10 day EMA has acted as end of day resistance.
- The 37.40 RSI has room to go lower before being over sold.
- $SPY remains under a bearish crossover.
- The trading range has continued to remain stable so far.
- The VIX closed the highest it has been post election at 15.96. Which is still low historically with room to expand higher.
- The market has held up very well so much with the tension of the headline risk.
- The best confluence of support levels will likely take place near the 100 day SMA, 30 RSI, and $230 price area. That is the spot I would be a buyer.
