Skip to content
 Chart Courtesy of StockCharts.com
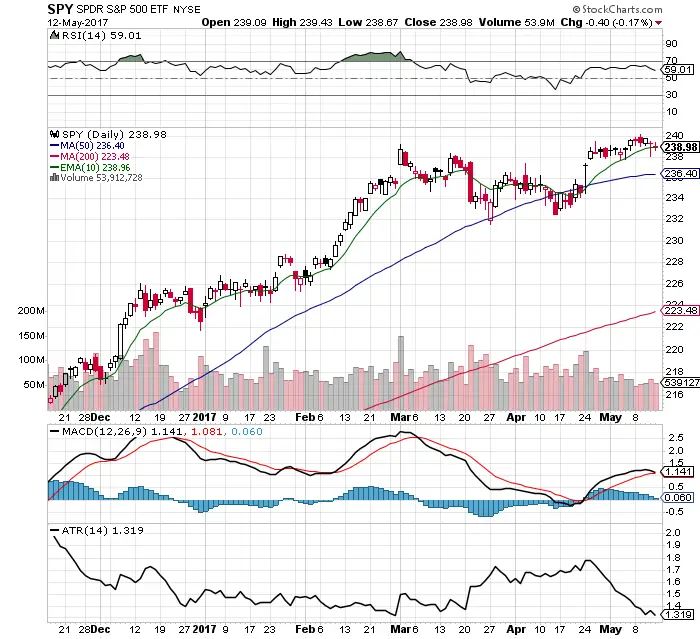
- $SPY is bullishly above all moving averages.
- $SPY is currently trading in a very tight range.
- $SPY resistance remains the all time high at $240 with support at $238.
- MACD remains currently with a bullish crossover but is turning down and near a bearish crossover.
- RSI is bullish at 59.01 and has room to run higher here.
- This is one of the top ten lowest volatility environments in the history of the stock market with VIX at 10.40.
- In the past 30 days ATR crashed from 1.80 to 1.31. Making it tough on day traders and trend traders.
- The market is fighting for higher highs on very low volume.
- Momentum is slowing as the 10 day EMA is beginning to be breached intra-day.
- The best risk/reward ratio is in buying dips back to the 50 day SMA if we get it.
