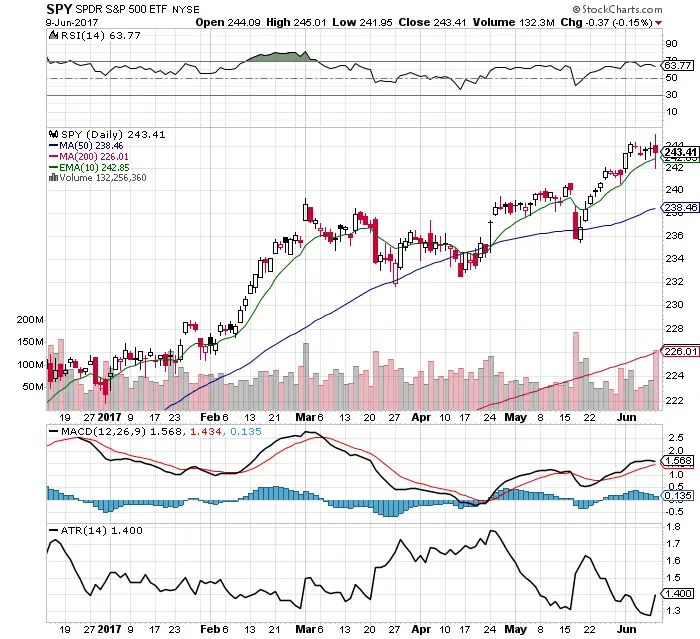
- SPY is still bullish and near all time highs.
- SPY has remained in a trading range for the past 7 trading days.
- The MACD is still under a bullish crossover.
- RSI at 63.77 is near overbought so the odds are on more consolidation before we go much higher here.
- Average true range expanded Friday giving day traders more room to trade with intra-day.
- Big volatility spike in VIX Friday to 12 but VIX closed at 10.70. This is a sign that we could see bigger swings in price in the coming week.
- SPY 23% weighting in tech weighed on it Friday.
- The SPY 5.9% energy and 13.92% financial sector weightings helped off set the tech losses Friday.
- Friday looked like the first signs of a big rotation by money managers from tech into energy and financials for a better risk/reward ratio.
- There also appeared to be some rotation from big caps to small caps late last week.
I am currently long $UWM and $ERX.