Skip to content
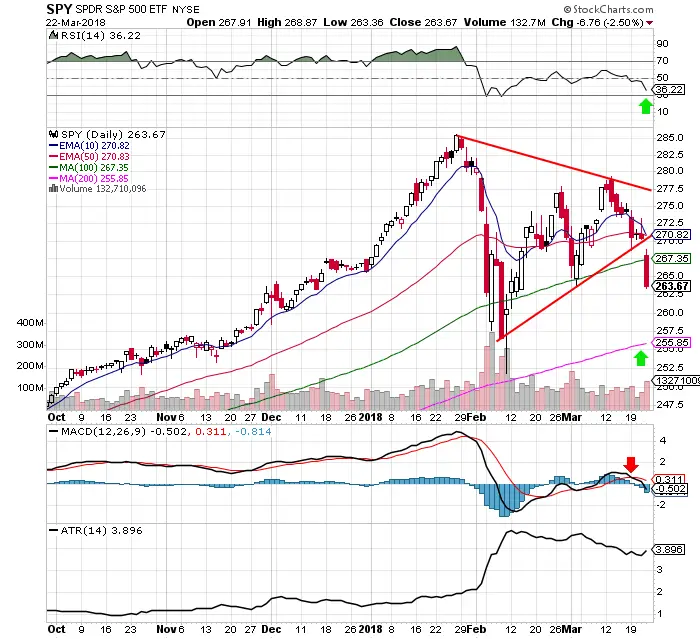
 Chart Courtesy of StockCharts.com
- This week $SPY has been under a MACD bearish cross under.
- On Thursday morning $SPY gapped down out of the symmetrical triangle pattern.
- $VIX spiked up to 23.35 this week.
- ATR slightly increased this week.
- RSI has stayed under the 50 RSI this week showing a loss of momentum.
- The uptrend is now damaged after a failure to get back to new highs this year.
- However settling into a short term range the long term trend is still up.
- One potential dip buy signal is $SPY falling to the 30 RSI to create very oversold conditions.
- Another dip buy level is price falling to the 200 day sma or losing it then retaking the level.
- The dip buys would just be short term trades selling into rallies back up to key levels of resistance like the 50 RSI or 50 day SMA.
