This is a guest post from Tino @tradersreality. This article originally appeared on tradersreality.com and is reposted here with permission.
Price, conventionally speaking, is the value that something holds at a point in time. Some lose their value, some hold, some gain.
But when it comes to trading. The principle is the same, however there are some differences.
Let’s get straight to it…
Market Makers. Everyone knows, what their sole purpose is. Everyone knows what they try to do, (they do it successfully) however the million dollar question is…WHEN.
When you look at a chart, most of the time you can develop an idea of what is happening. If the chart shows price increasing, usually your in an uptrend, decreasing, down trend etc etc. However, until you really focus on what is really happening, you will be amongst many who fall into the traps that these market makers set.
I love to trade USDJPY. The price levels in this pair usually get respected, so for me it’s my favorite pair.
Here is a classic example of why you must pay attention to price. A Brief explanation.

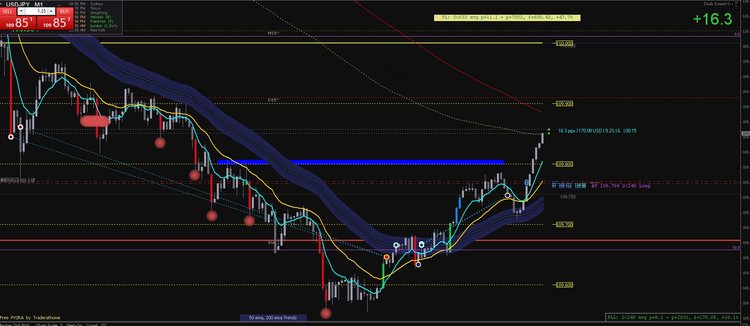
The chart above shows the 1 minute chart. Now the principle behind what I will be discussing can apply to all time frames, although the difference is what happens on a 1 minute chart will take much longer than say on a 4 hour chart.
As you can see the thick blue line is the 50 day moving average, it’s showing a downtrend. You will also notice the red candle sticks appearing as price trails down. The yellow lines are the price areas. In this instance they show 109.600, 109.700 all the way up to 110.00.
So what appears to be price descending, what is really happening is a move is being set up. The market makers are creating the illusion that there is a sell off and they want other participants (dumb money) to get involved with the action. So a new lower high is formed and then a lower low, that tells the average trader we are in a downtrend. Now this is all in favour for the market makers to create liquidity for a move that will happen later on. BUT…We do’n’t know when!!!!! So the red candlesticks that are showing a sell off are the market makers actually getting their long orders filled.
As you see, towards the bottom of the chart you will see a climatic red candle (longest red candle), now this usually implies that everyone is now jumping on the band wagon and have set their stop losses. The market makers can see these stops. Stops are money for the market makers. So they will take price to wherever they see money lying around.
You will see that price then trails along the 109.600 mark. Considering that most of the action occurred at this area, the market makers keep price within this range. This would have been your first clue that things may change.
The confirmation would have been the green candle that appeared. Here we see a notable candle coming into play, the market makers have revealed themselves. You will also see where i entered, faint blue dots. I took this trade after it reverted back to the 50 day and showed interest in the higher part of 109.600 area.
Notice how the green candle recovers the previous red candles. You then see price rising with more green candles and blue candles. These are the market makers closing their previous longs at higher prices.
What you must consider is this. Around each price level there is a red candle, or what is called notable volume candles. These are your clues by the market makers that you need to be aware of.
Now, all I have discussed is candlesticks and price and a moving average. But the main emphasis is on the behavior of the market makers around these price levels.
You must pay attention to notable activity when it occurs at these areas because it is there where the market makers reveal their hand.
Trade well
Tino.
You can follow Tino on twitter at @Tradersreality and visit his website at tradersreality.com.
