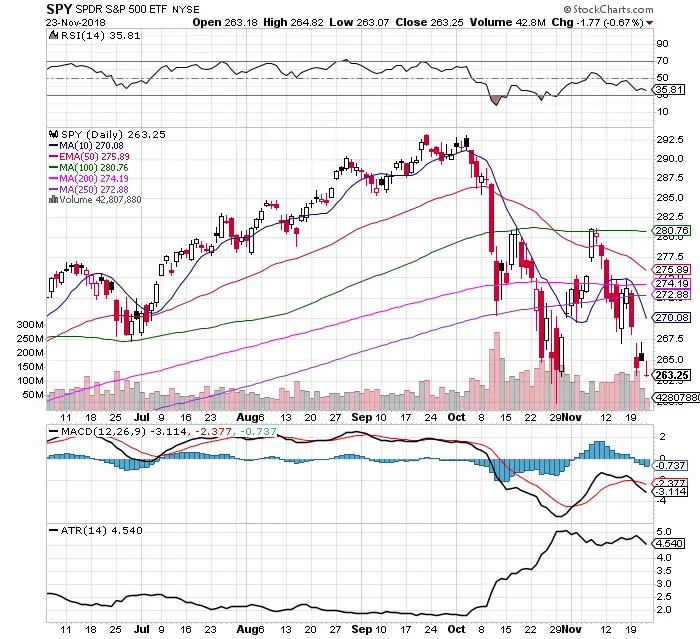
Chart Courtesy of StockCharts.com
- Price is under all key individual daily moving averages:
- The 5 day EMA.
- The 10 day SMA.
- The 50 day SMA.
- The 100 day SMA.
- The 200 day SMA.
- The 250 day SMA.
2. Several bearish moving average cross under signals have triggered:
- 10 day / 50 day SMA cross under
- 50 day / 100 day SMA cross under
- 10 day / 100 day SMA cross under
- 10 day / 200 day SMA cross under
- 10 day / 250 day SMA cross under
3. The MACD is under a bearish cross under.
4. The $VIX remains under a 10 day / 30 day EMA crossover that is a bearish signal showing an expansion in volatility based on backtesting.
5. The RSI at 35.81 can still go lower before becoming oversold under 30.
6. Defensive sectors are leading the S&P 500 index and the stock market: utilities, consumer staples, and health care. $XLU $XLP $XLV
7. The $SPY low of $259.85 is in danger of being tested.
8. A $SPY close over the 250 day SMA is the closest moment signal to go long this chart.