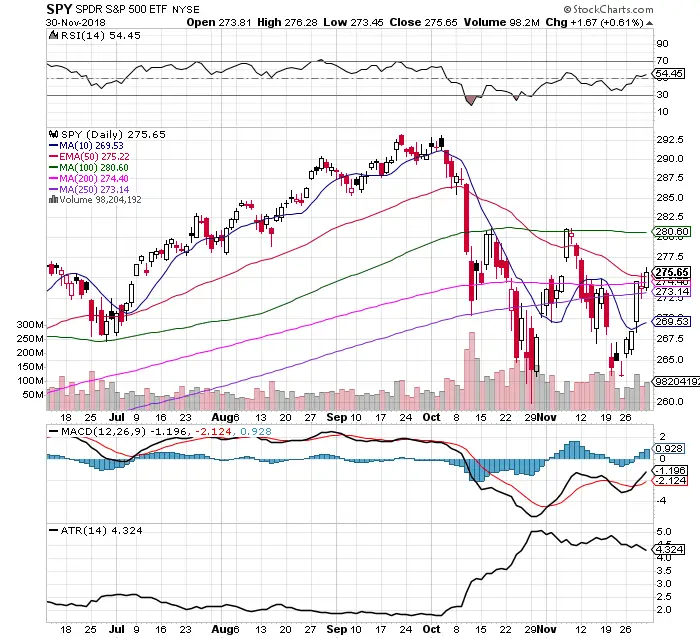
Chart Courtesy of StockCharts.com
- $SPY set off bullish reversal signals by closing over the 50 day, 200 day, and 250 day moving averages on Friday.
- The Fed chairman’s dovish comments lead the markets to believe that they could be more accommodative on monetary policy than previously thought.
- $SPY finished higher than the previous close 4 out of 5 days last week.
- $SPY closed higher than it opened all 5 days last week.
- $SPY did not make a new lower low on November 23rd.
- The average true range has been contracting with lower highs and lower lows showing a decline in volatility since the retest of the lows held.
- The MACD had a new bullish crossover last week.
- $SPY RSI is back up over 50 at 54.45 for the second time since the October 4th sell off.
- The $VIX had a bearish 10 day / 30 day EMA cross under that is a signal for decreasing volatility and less fear in the market.
- The chart currently looks like the lows held and the correction is over for now. A close below the 250 day SMA would invalidate the current bullish signals in my system.