Charts Courtesy of StockCharts.com
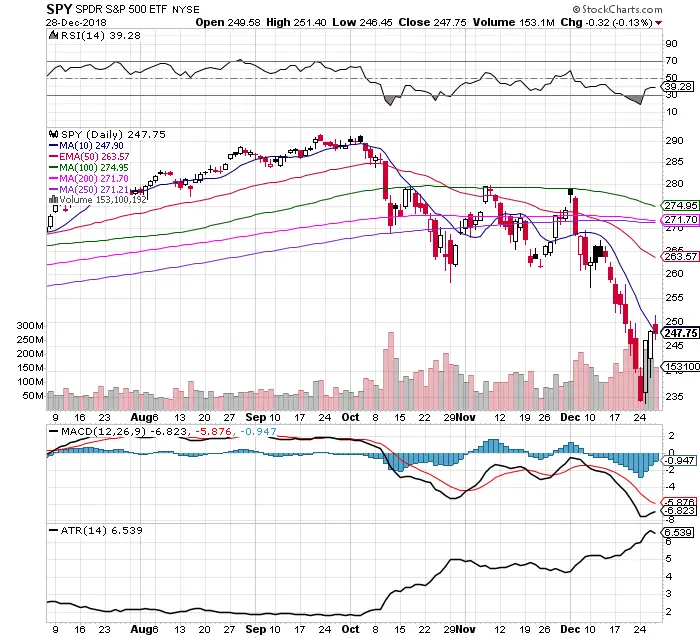
- $SPY price remains under all key moving averages even after last week’s rally.
- All my moving average systems remain with cash signals here.
- The ATR continues to be near the yearly high at 6.53 due to the huge intra-day moves last week.
- The MACD remains under a bearish cross under.
- The RSI emerged out of extremely over sold conditions to close at 39.28 on Friday. The 50 RSI tends to hold as end of day resistance during downtrends in price.
- The Christmas Eve drop was the biggest decline on that day of all time.
- The volume on the down swing was on increasing volume until Christmas Eve.
- The volume on the bounce was on declining volume last week as the days played out.
- $VIX continues to signal expanding volatility with the 10/30 day EMA crossover at 28.34.
- The bounce is not yet confirmed based on my signals. I need to see price close over the 10 day EMA, the 50 RSI, and increasing volume as my first step to looking to get back long. I have been long silver, gold, and miners. $AGQ $UGL $NUGT. I am currently still holding $NUGT and $AGQ.