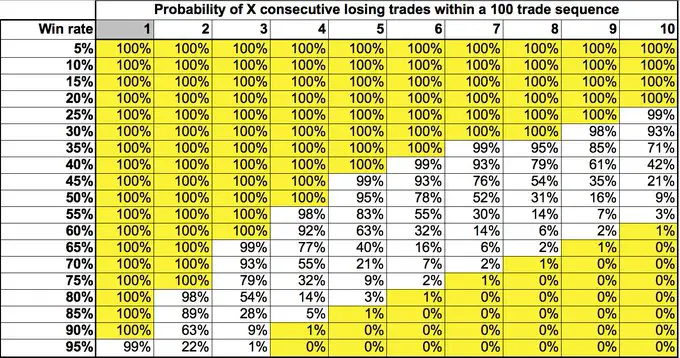
This table shows the probability expressed as a percentage for the odds that you will have a certain number of consecutive losing trades in each 100 trade sample of your trading.
For example if your win rate is 50% then 9% of the time you will have 10 losing trades in a row for each 100 trades you make. If you make 1000 trades the odds are close to 100% that you will have a 10 straight trade losing streak inside that sample size.
Your own win rate can be derived from your historical record of trading or your backtested signals. Your win rate is a very important part of understanding if you have a positive expectancy system and if you will blow up your account based on an inevitable losing streak if your position sizing is too big.
This chart is a great guide for the math and expectancy that losing trades. losing streaks, and drawdowns are just part of the cost of doing business as a trader.
