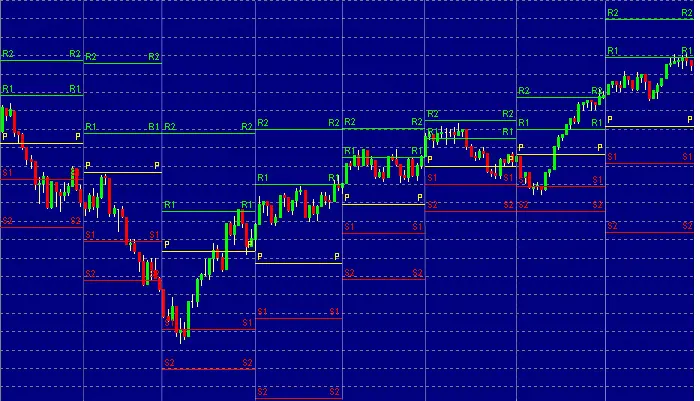
A pivot point is a specific price level calculated and then used as a technical analysis indicator and trend filter in a chart’s time frame. A charts pivot point level is the average of the high prices, low prices, and closing prices from the last trading day. Price trading above a pivot point signals a potential uptrend and price trading below the pivot point signals a possible downtrend.
The pivot point is the foundation for the technical indicator and other price support and price resistance levels that are also projected by using the pivot point calculation. The price levels created by using the pivot points show traders where potential price could see support or resistance levels emerge. Also when the price breaks these key levels it signals to a technical trader the price is currently in a trend in the direction of the break out.
There are different ways that are used to calculate the pivot point of price action on a chart. It is usually considered to be the mathematical average of the high price, low price, and closing prices of a market in the previous trading periods:
P = (H + L + C) / 3.
Many times the average also includes the previous period’s or the current period’s opening price:
P = (O + H + L + C) / 4.
Some traders like to focus on the closing price, P = (H + L + C + C) / 4, or the current period’s opening price, P = (H + L + O + O) / 4.
- P= Pivot Point
- H=High Price
- L=Low Price
- C=Closing Price
- O=Opening Price
Below is the monthly pivot point chart of the DJIA for the first 8 months of 2009 near the market bottom, the below chart shows the first and second levels of resistance in green and support with red. The pivot point levels are in yellow. Trading below the pivot point, particularly at the beginning of a trading period sets a bearish market sentiment and often results in more of a price decline, while price is above it a move higher may continue until it is lot again.
A pivot point can be both a range bound indicator and show where to look for buying dips and also a trend trading indicator on breakouts.
