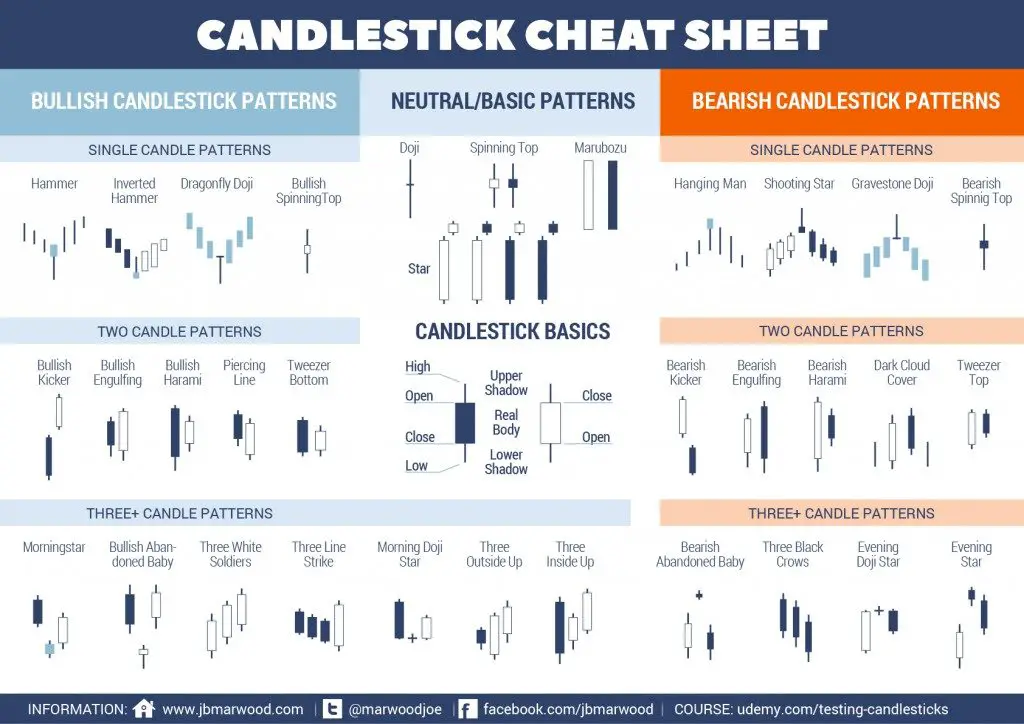
A candlestick is a type of chart used in trading as a visual representation of past and current price action in specified timeframes.
Depending on the timeframe of the chart each candlestick consists of each minute, day, week, or month trading range represented in a single candle.
A candlestick consists of the ‘body’ with an upper or lower ‘wick’ or ‘shadow’.
Most candlestick charts show a higher close than the open as represented by either a green or white candle with the opening price as the bottom of the candle and the closing price as the high of the candle. Also the majority of candlestick charts show a lower close than the open represented by either a red or black candle with the opening price as the top of the candle body and the closing price as the low of the candle body.
Price action that happens outside the opening and closing prices of the time period are represented by the wicks or shadows above the body of each candle. Upper wicks represent price action that occured above the open and the closing prices and the lower wicks represent price action that occurred below the opening and closing prices.
Candlesticks are one type of chart that can be used in technical analysis to look for repeating patterns and in correlation with other technical indicators and signals.
Candlesticks are combined in many ways to try to read the behavior of traders and investors in buying and selling to create good risk/reward setups for trading.

Here are many of the most popular candlestick chart patterns:
