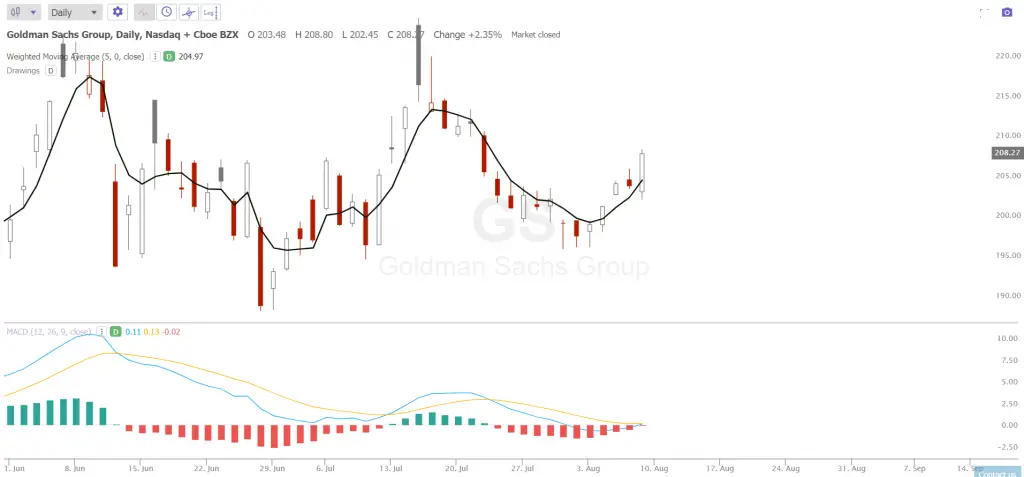
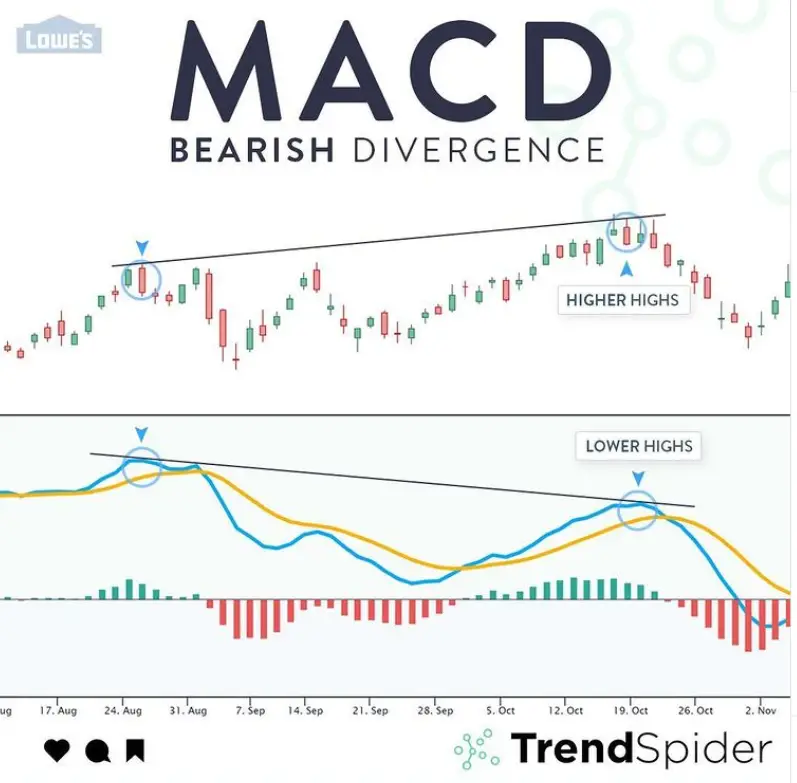
The MACD-Histogram quantifies the distance between MACD and its 9-day EMA signal line. The histogram reads positive when MACD is above its 9-day EMA and reads negative when the MACD is below its 9-day EMA. The MACD-Histogram is a technical oscillator that moves both above and below the zero line on its chart. The MACD-Histogram is a technical indicator that tries to anticipate and front run the signal line crossovers in MACD.
Since the MACD is created by moving averages and they wait for confirmation the signal comes after the first momentum of a movement has begun. MACD-Histogram crossovers of the zero line can be standalone momentum, swing, or trend signals on the chart. Both bullish and bearish divergences that happen on the MACD-Histogram chart can be technical indicators that a signal line crossover in MACD is about to happen.

Chart courtesy of TrendSpider.com
MACD-Histogram calculation formula:
MACD: (12-day EMA – 26-day EMA)
Signal Line: 9-day EMA of MACD
MACD Histogram: MACD – Signal Line
The MACD-Histogram is a technical indicator designed to identify convergence, divergence and crossovers in a charts price action in relation to the MACD indicator. The histogram on the chart has a positive reading when the MACD is above its own signal line. Positive values grow higher as MACD diverges away farther to the upside from its signal line and declines lower as the MACD and its signal line converge closer.
The MACD-Histogram crosses under its zero line as the MACD crosses below its own signal line. The MACD-Histogram indicator is negative whenever the MACD is below its own signal line. Negative values go lower when MACD diverges further downward and away from its own signal line . Inversely, the negative values decrease as MACD converges back closer to its own signal line.
The MACD-Histogram is one tool technical analysts use to measure moment on a chart for swing and trend trades in the direction of the momentum signal over the zero line.

