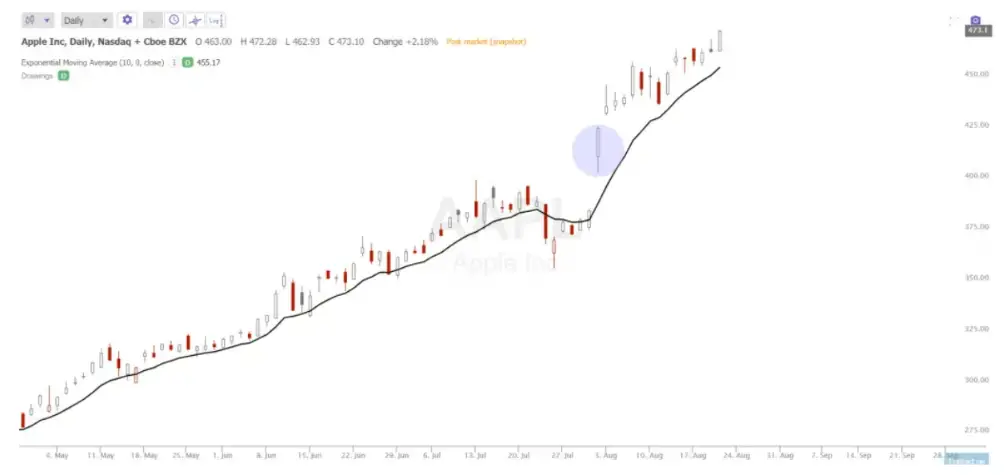
A breakaway gap is a chart pattern in technical analysis that shows a big opening gap in price above the previous day’s closing price. The gap in price action on the chart is where no trading took place between buyers and sellers. A breakaway gap to the upside has to break above previous resistance while a breakaway gap to the downside has to break below the previous support.
The price action in this pattern breaks away from the support or resistance zone in a chart via a gap on the next open instead of during intraday movement. To capture a breakaway gap a trader usually has to hold overnight or trade in the after hours. A breakaway gap is one of the biggest momentum signals indicating the beginning of a new trend or continuation of a trend already taking place. This move has to happen as a breakout of a trading range to be valid and a break to all time highs or all time lows are the strongest signal of a new trend beginning.
A breakaway gap is a breakout momentum gap signaling a continuation in the direction of the gap. Most breakaway gaps ignore overbought or oversold indicators and go parabolic in one direction. Most of the time this type of gap in a stock happens after an earnings report. Other types of gap moves are runaway gaps, exhaustion gaps, and ordinary price gaps.
One way to trade bullish breakaway gaps to the upside:
- Bullish breakaway gaps can be bought at the open for a potential quick gain but there is still a high possibility that the gap could collapse. An early morning gap that fails can be a volatile reversal but the odds are that the right leading stock will continue in the direction of the gap for at least the rest of the day. Better odds for an entry working is if a trader waits for the gap to hold for the first hour of trading then enter. There may be a better entry on a pullback and avoid being caught if the gap fails and price collapses back down. Buying breakaway gaps at the end of the day provide the highest probability that it is a gap and go and not a gap and crap.
- Gaps in high volatility charts don’t tend to hold up and trend as well as a gap out of a clean price base.
- A gap above all time highs has a better chance of success than a random one inside an old price range where people are trapped and want to get back out at even.
- A gap to new all time highs is powerful as all holders are now in a profit and tend to just let their profits run.
- Shorts caught with a position in breakaway gaps to the upside can be additional buyers pushing the trends higher as they are forced to buy to cover.
- A great place to set a stop loss when buying a gap is under the lowest price of the gap up day, price should not fall below that level if it is going to trend higher. Using an end of day stop gives you better odds of not being stopped out if it just dips there temporarily.
- After the low of the day holds and a trend begins over multiple days then the trailing stop can be moved to the 10 day EMA and then the 5 day EMA to lock in profits but allow the trend to continue in your favor. On a very volatile stock some use the 20 day ema as a trailing stop to not be shaken out of a winner.
- Also be aware that a momentum growth stock that gaps up and trends doesn’t have long term resistance just pauses between higher highs. Overbought indicators are worthless in momentum growth stocks under heavy accumulation by money managers as the chart goes parabolic. RSI extremes can go farther than expected.
- When caught on the wrong side of a breakaway gap against you it’s best to just exit in the first 30 minutes, if the gap holds and makes higher highs after the first thirty minutes of the trading day it usually just gets worse as the day goes on.
- Gaps have a way of leaving many retail traders on the sidelines because they think that was the move and they don’t want to chase it. Some of the biggest winning trades can be buying into breakaway gap ups with the right position sizing and letting the winner run.

Chart courtesy of TrendSpider.com