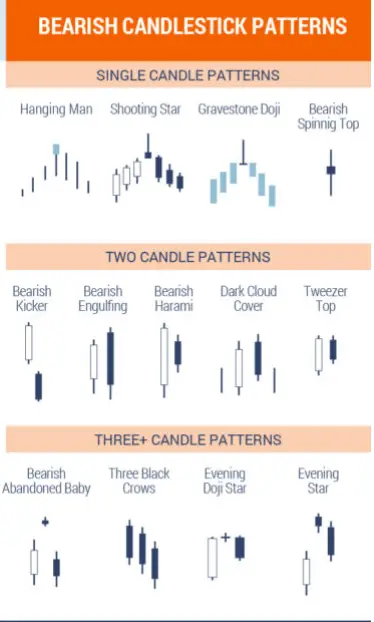
Bearish candlestick patterns on a chart visually show selling pressure. These patterns can show the possibility of a price reversal during an uptrend or the continuation of a downtrend already in place. There can be single bearish candles or bearish candlestick patterns containing multiple candles in row.
Here are some of the most popular bearish candlestick patterns:
- Hanging Man
- Shooting Star
- Gravestone Doji
- Bearish Spinning Top
- Bearish Kicker
- Evening Star
- Bearish Engulfing
- Bearish Harami
- Dark Cloud Cover
- Tweezer Top
- Bearish Abandoned Baby
- Three Black Crows
- Evening Doji Star
- Evening Star

Image courtesy of JB Marwood and his Candlestick Analysis For Professional Traders
Bearish candlestick patterns visually show the failure of buyers to take a price higher and sellers take control of a chart for the timeframe of the price action. These are bearish signals that need confirmation with a down swing in price after the pattern forms.
The meaning and value of bearish candlesticks must be considered taking into the context of a chart pattern and their confluence with other signals. A bearish candlestick pattern that happens when a chart is overbought could signal a reversal of an uptrend. Bearish candles that happen late in a downtrend after a long term drop in price after a chart is already oversold can have a lower probability of success.
Bearish candlestick patterns that have a confluence with other systematic short selling signals increase the odds of trade success.