The 200 day moving average is one of the most popular price levels used in technical analysis. It is used in classic charting to define uptrends and down trends in markets.
Here are twelve ways that the 200 day moving average can be used in technical trading:
- A close below the 200 day can signal danger of a downtrend and signal it is a good time to go to cash.
- During a bear market or downtrend after price is trading under the 200 day a break back over the 200 day can signal a buy.
- The 200 day moving average can be used as a trend filter by only taking any type of long signals that happen above the 200 day.
- The 200 day moving average as a trend filter can be used as an alternative to buy and hold investing as a place to go to cash when lost to avoid bear markets, crashes, or downtrends in price.
- The 200 day can be used as a risk management tool to exit any stock or investments that drops below that line to avoid big losses. It is one way to limit drawdowns in capital.
- It is a great place to start with backtesting to see if a chart trends higher smoothly over time.
- The 200 day can be used as an end of day signal to avoid premature signals intraday.
- The 200 day can be used as an end of month signal to avoid premature signals during the month.
- If you want to sell a chart short a loss of the 200 day moving average can be one signal to go short.
- An initial 200 day signal can be followed up by letting a winner run with a trailing stop of a short term moving average.
- If a trade fails to trend after a 200 day signal the stop is the loss of the 200 day, this keeps losing trades small.
- The 200 day moving average can be used as a classic trend following signal by going long when price breaks above the 200 day and then exiting and going to cash when price breaks below the 200 day moving average.
The 200 day moving average can be used as standalone entry and exit indicator in stocks in the strongest uptrends.
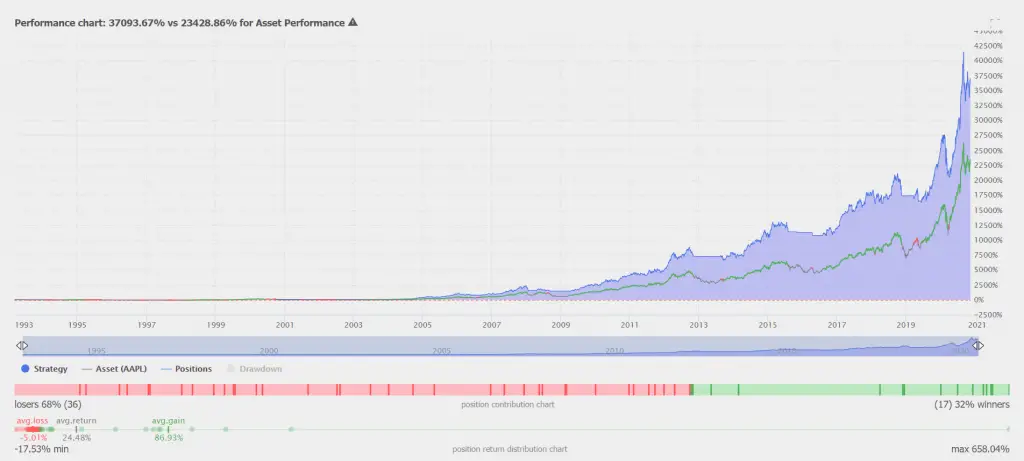
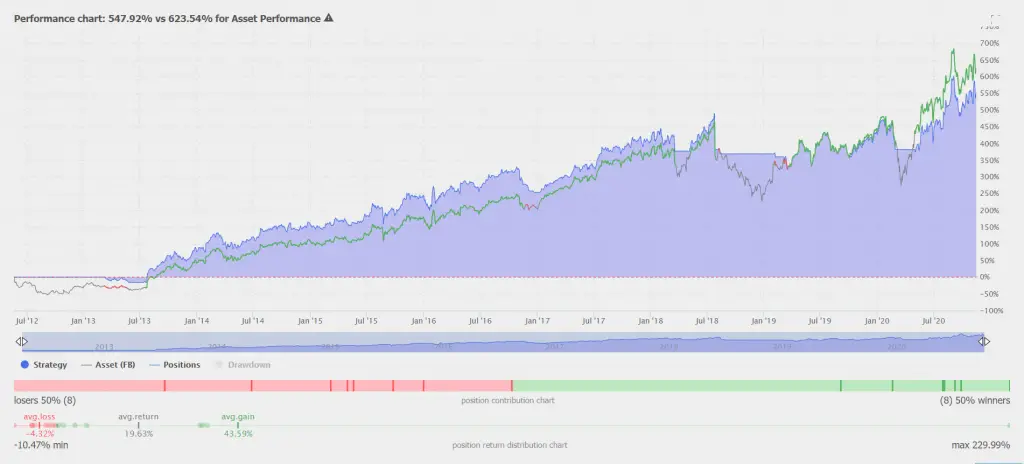
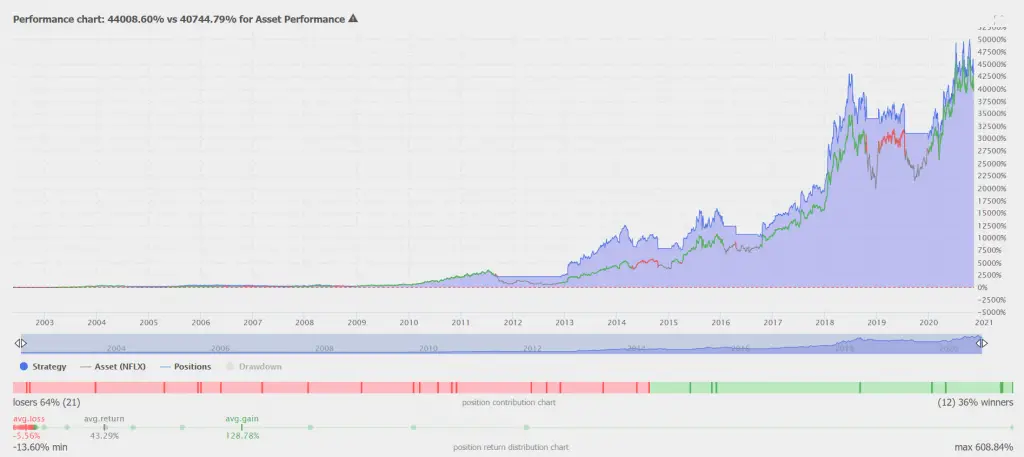
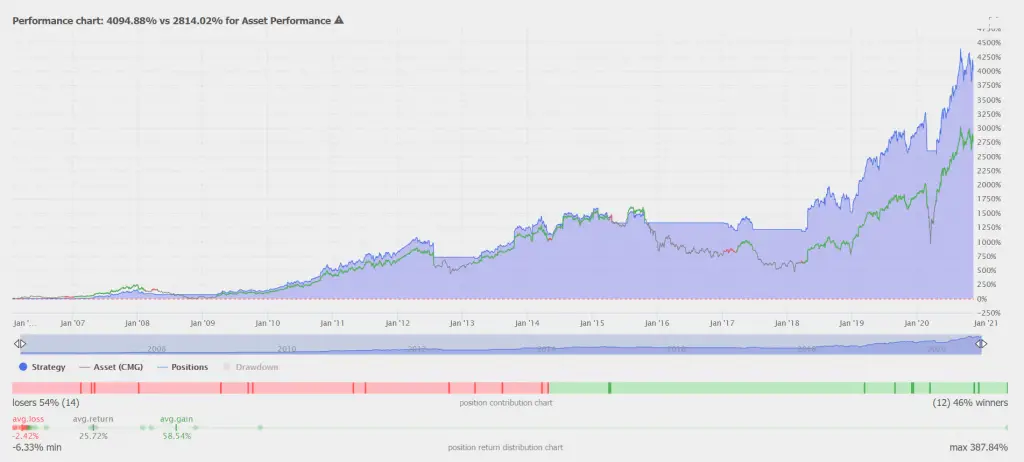
The following backtests are based on the entry signal of when price crosses up through and closes above the 200 day moving average it goes long when price closes back below the 200 day the signal exits and goes to cash until the next break back above.
Below is a list of five popular stocks that beat buy and hold investing by using the 200 day alone as a trading signal.
Apple 200 day moving average backtest:
Facebook 200 day moving average backtest:
Netflix 200 day moving average backtest:
Chipotle Mexican Grill 200 day moving average:
CarMax 200 day moving average:
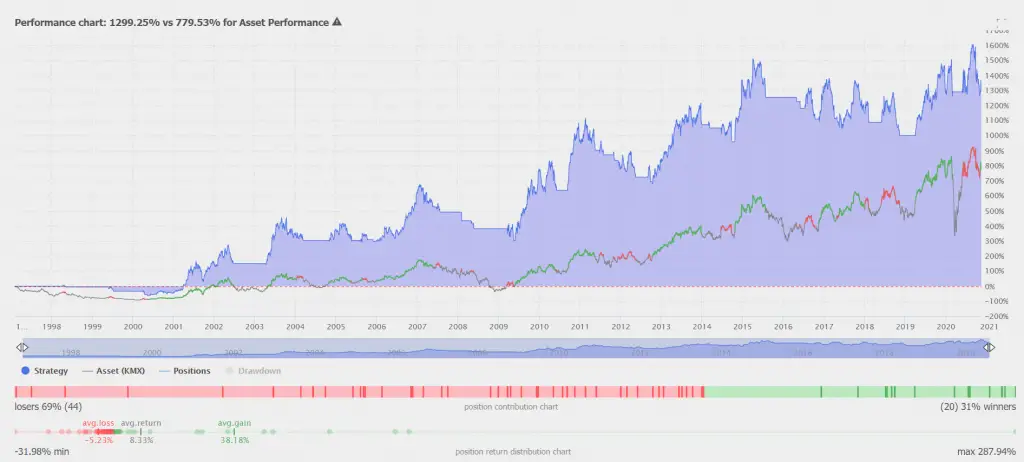
All backtest data is courtesy of the TrendSpider.com platform.
The key is creating a great watchlist of stocks to trade it with, you only need a few big winning stocks to make the whole system profitable. The 200 day is a great trend filter for stocks, keeping a trader in the ones trending up and out of the ones trending down. The key is that the 200 day filter lets winners run, cuts losers short, and signals to get into and out of bull markets early in a long term trend.
The biggest weakness of the 200 day moving average as a signal happens on charts that chop around the 200 day for long periods of time due to volatility and creating too many false signals.
Many times when backtesting stocks and ETFs with the 200 day moving average it will show as a profitable signal and a positive expectancy model even if it doesn’t beat buy and hold investing on the chart.
This type of trading is in the same time frame as trend followers and investors and can be considered an alternate.
You can learn more through my Moving Average Signals eCourse.
