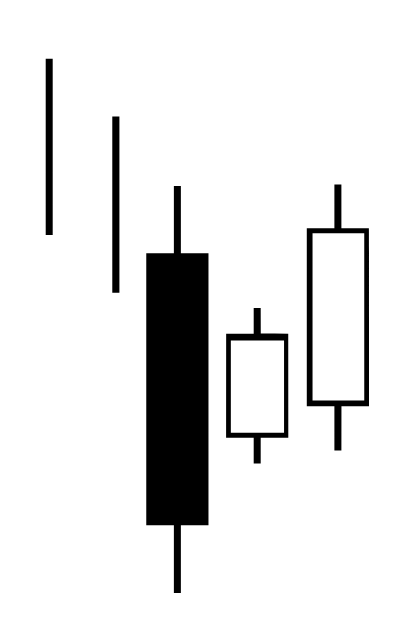
An inside candle shows price is trading within the previous range of a time period. An outside candle shows price broke out of the previous range of a time period in both directions. These candlestick patterns can show a trader if a chart is currently trading in a range or breaking out trying to swing or trend in one direction.
An inside candle on a chart shows that the high price for the current time period is lower than the high of the previous period and also that the low price for the current period is higher than the low of the previous day.
Inside candle:
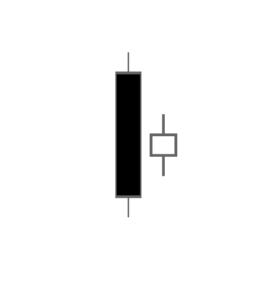
The price action for the current inside candle above all takes place inside the previous candle. This price action candle pattern shows a range and consolidation of movement. The inside candle shows that sellers and buyers at this price range are balanced as buyers can’t drive the price higher and sellers can’t take it lower. This shows current price agreement, a future break through one side of the previous candle will show what side wins.
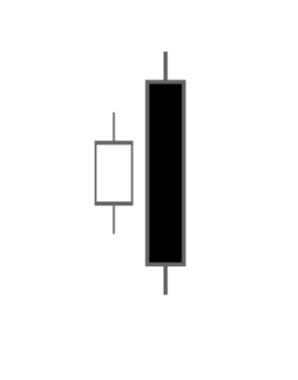
An outside candle shows price action of the new candle happening outside of the previous candle. To qualify as an outside candle, price action needs both a higher high and a lower low in relation to the previous day.
Bearish outside reversal candle:
Wikipedia
Bullish outside reversal:
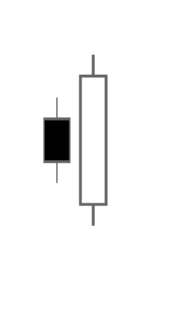
The price action of an outside candle is the opposite of the inside candle. While an inside day has contracting price action and less volatility an outside candle has expanding volatility and two moves outside the previous range, both above the previous candle high and below the previous candle low. The most telling signal of the outside day is where the candle ends up showing whether buyers rejected highs and ended near the lows or sellers rejected lows and it ended near the high.
Outside reversal candles are also commonly called a bullish engulfing if it happens after a downswing in price or a bearish engulfing pattern if it happens after an upswing in price on candlestick charts.
Outside candles can be bullish, bearish or neutral signals based on the close. An outside candle near an overbought or oversold area or close to support or resistance can provide a confluence signal with other technical indicators for better odds of success. An outside candle can signal a continuation pattern in a trend if it closes near the high during an uptrend or near the low during a downtrend.
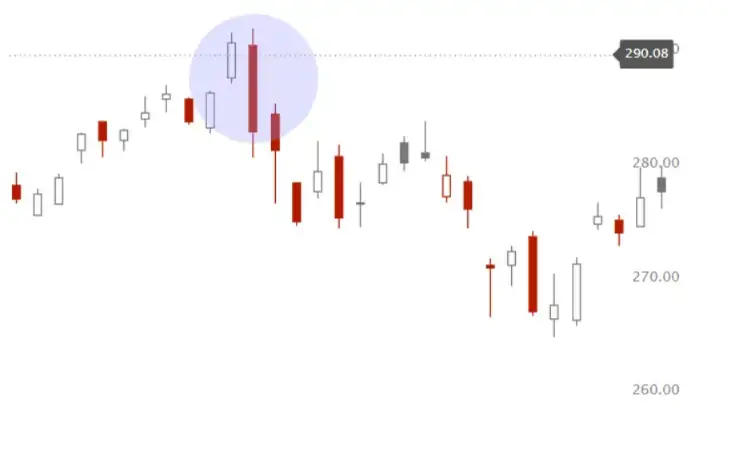
Bearish outside candlestick pattern on the DIA chart:
