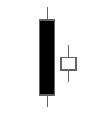
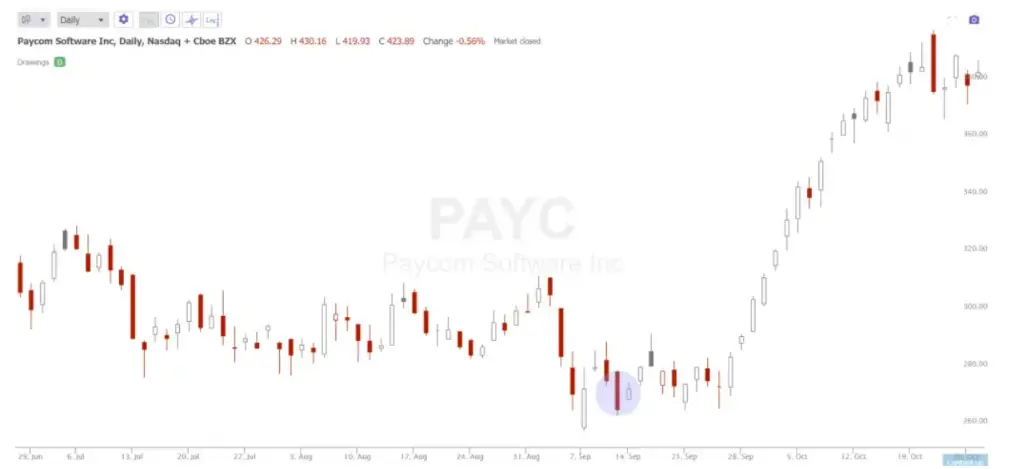
A bullish harami is a minimum two candle chart pattern that can signal a downtrend in an chart may be starting to reverse. A bullish harami is commonly formed by a small bullish candle that has a price range inside the previous bearish candle that went lower. This pattern can appear to form during a price range but it has the most meaning when it occurs during a downtrend on a chart.
The word harami comes from a Japanese word meaning to be pregnant. This candle pattern shows metaphorically that a large bearish ‘mother’ candle is ‘pregnant’ with a smaller bullish ‘baby’ candle.

Many times the second bullish candle is a doji and this indicates that sellers were not able to take prices any lower. It shows bullish sentiment set in as it closed higher than the open. Also, volatility contracted and the smaller trading range shows more agreement by traders at these prices. The bullish harami can mark the end of a downtrend as no newer low in price was set and it shows a high probability signal for a reversal back to higher prices.
A bullish harami candlestick pattern has better odds of working if it happens on a chart in an oversold area like a 30 RSI or a lower 2nd or 3rd deviation from the 20 day moving average. This pattern is a reversal signal in downtrend giving a dip buy signal.

Chart Courtesy of TrendSpider.com
