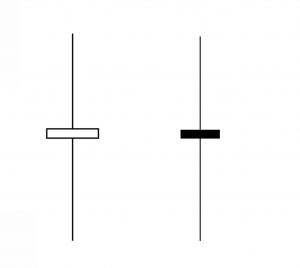
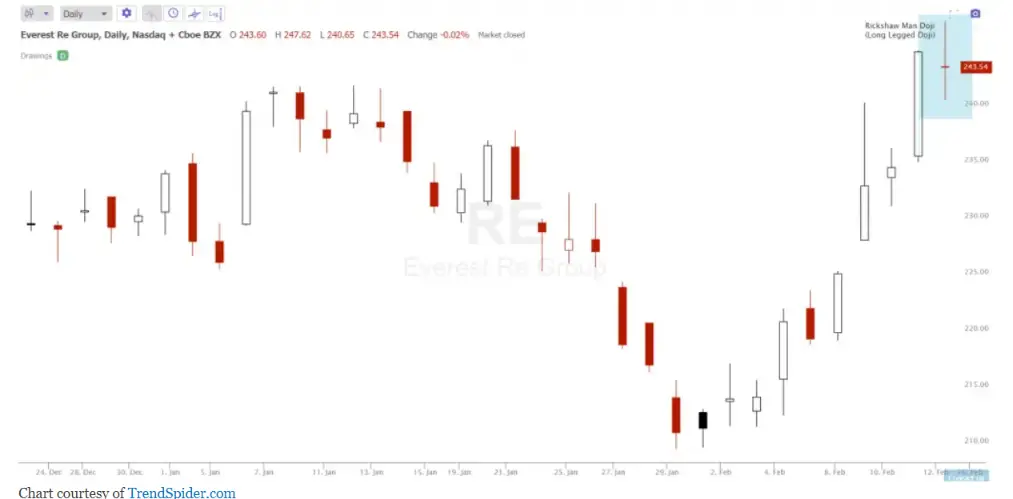
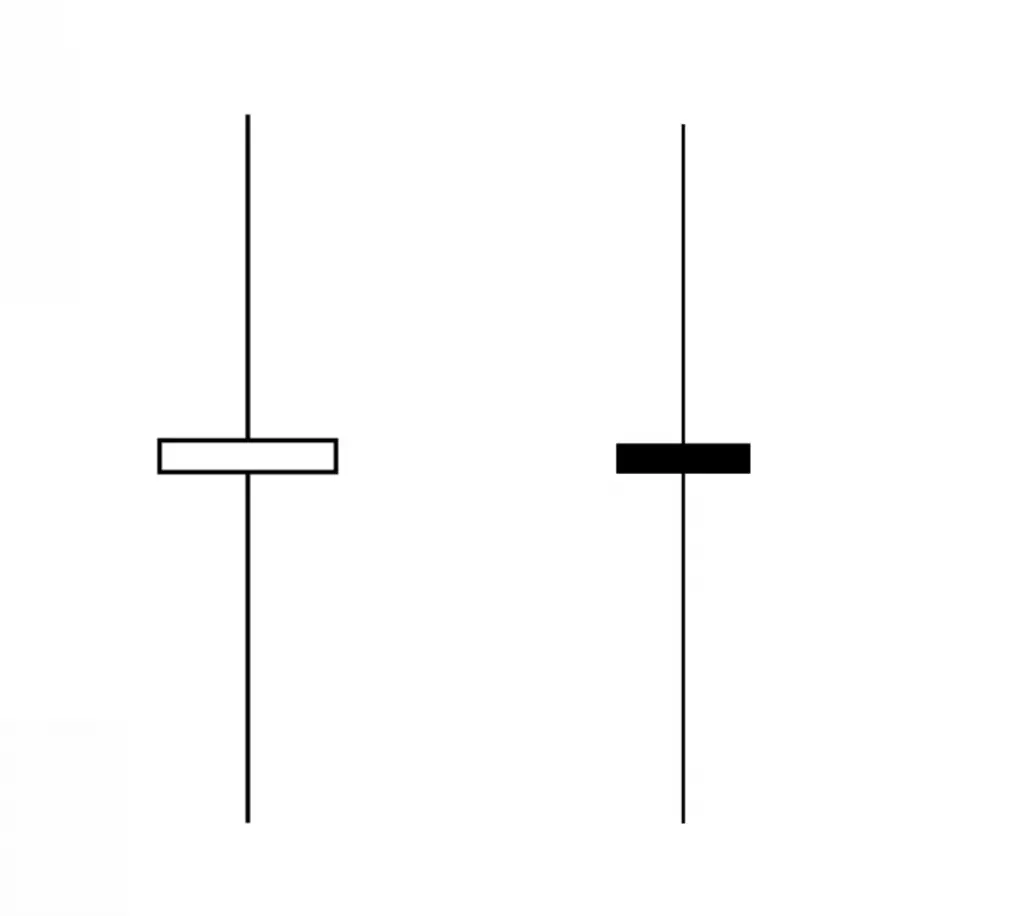
A rickshaw man doji is also called a long legged doji and is a candlestick pattern that have a tiny body with the open and closing prices almost the same and long wicks/shadows both higher and lower. They are neutral as a standalone candle but can also show turning points when they form at extremes near the end of a trend.

In an uptrending market a long-legged doji can warn of an impending reversal to the downside. In a downtrending market a long-legged doji can signal a potential reversal to the upside.
Wherever this candle forms it signals a volatility expansion, this generally shows that a trading price range is going to expand and also the odds are that a chart will eventually move lower over time.
Long-legged doji candles can just signal the end of a trend and the beginning of a sideways range bound market as neither buyers or sellers can get the upper hand in bidding a market up or down. Buyers and sellers are always equal in trading action it is the price that changes and moves based on current bid/ask spreads agreeing to make a trade. A long-legged doji shows an agreement was reached by the end of a period after a wide trading battle between buyers and sellers happen over a large range of prices.
- Long-legged doji have long upper and lower wicks and a tiny body with the opening and closing price almost the same.
- This candle pattern signals indecision.
- It can be a reversal signal during strong trends.
- It can also signal a new range bound market.
- It can signal an expansion in volatility.
- Many traders will wait for the next candle on the chart after the long-legged doji to confirm a reversal as waiting for confirmation creates a higher probability of success than signaling off just one candle.
- The long-legged doji can be caused by a news event that drives volatility expansion as the new information is priced into the chart.
- The odds of it being a reversal signal are higher when the long-legged doji candle occurs in an uptrend near an overbought reading or it appears in a downtrend near an oversold reading.

Chart Courtesy of TrendSpider.com
