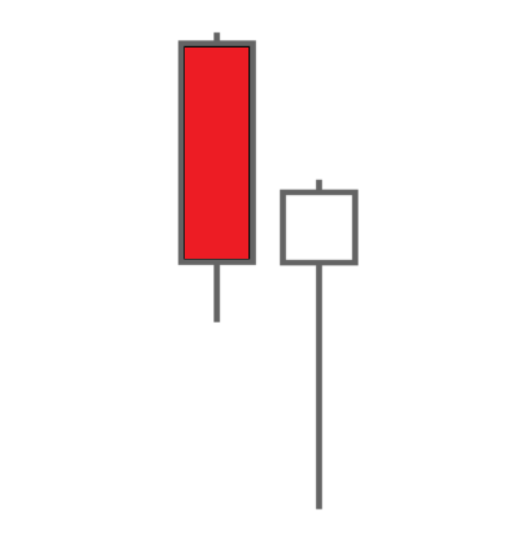
The Judas candle pattern consists of a large red bearish candle followed by a long bullish white reversal candle with a long lower tail which is approximately equal to the bearish candle in length. It can be a powerful bullish signal when it appears after a downswing or downtrend in price action.
This bullish candlestick pattern signals a high probability of a near term bottom in price action and that momentum has shifted back to the upside. The first candle shows distribution and selling pressure but the second candle candle starts with a selloff but buyers come in to push the price back up off the lows to finish back inside the the previous candle trading range. The second candle finishes near the highs of the period showing new accumulation.
This candlestick pattern is a type of pinbar reversal and is most valid when it occurs near key price support levels on a chart, at oversold conditions like the 30 RSI, or a lower third deviation Keltner Channel.
It is named after Judas Iscariot the disciple that betrayed Jesus as the bullish candlestick pattern betrays the previous bearish candle and reverses from the lows to set up a bullish reversal.
