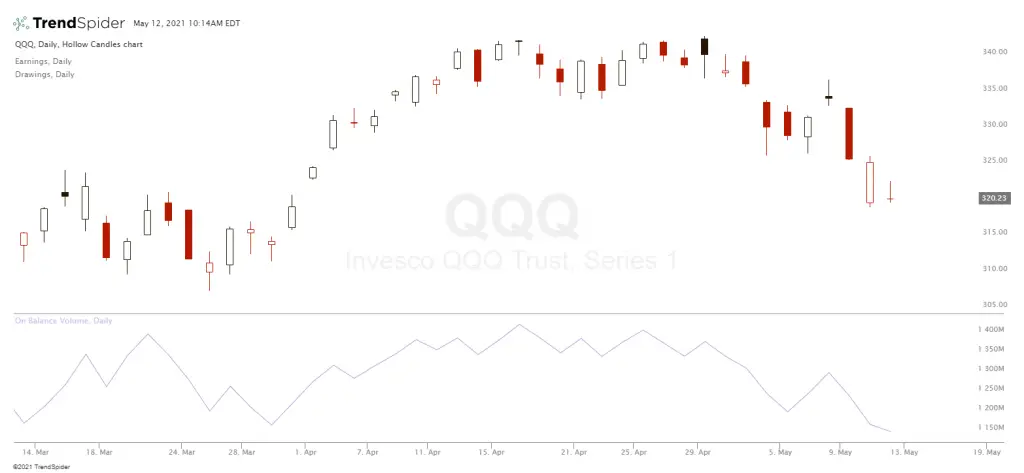
On-Balance Volume (OBV) is a type of momentum indicator that uses volume to project the potential for price change. It measures buying and selling pressure as a cumulative indicator. By adding up the volume on up days and subtracting volume on down days, the indicator calculates and quantifies when the market is showing accumulation and when it’s showing distribution on a chart independent of pure price. Volume may show something different happening underneath the actual price action or it could confirm the current trend.
OBV was created by Joe Granville and shared in his 1963 book “Granville’s New Key to Stock Market Profits.” This was one of the first technical indicators to measure positive and negative volume flow on a chart. Technical traders can see divergences between OBV and price action to project price movement probabilities or use the OBV to confirm a trend currently underway on a chart.
The On Balance Volume (OBV) line on a chart is the running total of positive and negative volume. A time period’s volume is positive when the close is above the prior closing price and is negative when the close is below the prior closing price. This can be applied to any time frame to see the flow of volume in correlation to the trend of price action.
Granville believed that volume comes before prices. OBV increases when volume on up days is more than volume on down days. OBV decreases when volume on down days is higher. An ascending OBV shows positive volume pressure that can project higher prices. The inverse is a descending OBV that shows negative volume pressure that can project lower prices. Granville saw through his own research that OBV would many times move before price action followed. Price should move higher if OBV is increasing while the prices either stay flat or are even moving lower. Price should move lower if OBV is decreasing while prices are flat or even moving higher.
The actual value of OBV isn’t an important factor. Technical traders need to focus their attention on the trend and momentum of the OBV line itself. Defining the directional trend line for OBV is the most important factor in using it. Observe whether the current trend of OBV is the same trend for the underlying stock or trading vehicle on the chart. Look for key support or resistance levels. Once broken the trend for OBV could change and these breakouts could be used as new trend signals.
OBV is based on the closing prices of the chosen time frame. Closing prices should be what is considered when analyzing divergences or support/resistance break outs. Large increases in volume can at times distort the indicator by causing a large sudden move that will take time to average out in the OBV indicator.
Bullish and bearish divergence signals on the OBV versus price action can signal a high probability of a trend reversal happening. These signals are based on the belief that the volume on a chart will indicate the direction of the next price move. A bullish divergence happens when OBV moves higher or has a higher low at the same time prices move lower or form a lower low. A bearish divergence happens when OBV moves lower or creates a lower low as prices move higher or form a higher high. The divergence between OBV and price action should signal technical traders that a reversal in price action could soon follow.
OBV is a leading indicator that shows the strength of current volume in correlation with the directional move of price action, Big volume increases can impact this indicator reading for a time period. Other technical indicators should be used in correlation with OBV to get a more complete picture of volume and price action as this is just one metric on a chart.
