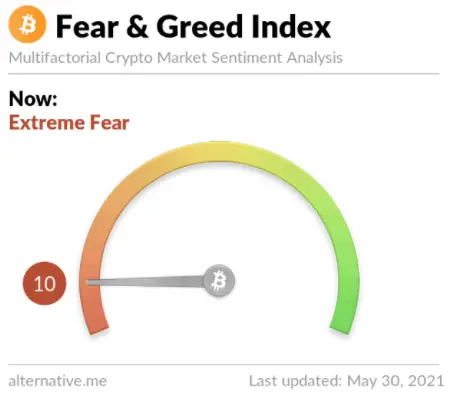
The Bitcoin Fear and Greed Index tries to quantify the strength of current emotions and overall sentiment on the Bitcoin chart by using different sources and calculate them into one number.
The Bitcoin Fear & Greed Index is bound between the values of 0 and 100 on its reading. A value of 0 means the chart has reached a level of extreme fear in the market and a value of 100 represents the chart has reached levels of extreme greed in the market.
Cryptocurrency trading can be very emotional. Crypto traders can get very greedy when the price chart is going higher so fast it creates the fear of missing out for those on the sidelines drawing more capital in. Crypto traders can also be driven by fear to sell their holdings when price is falling fast and by a high percentage. This index is an attempt to measure the extremes in both directions.
- Extreme fear on a chart can show a good risk/reward ratio at extremely low prices and be a buy signal.
- Extreme greed on a chart can show little reward remaining and the growing risk of holding at overbought price levels, this can be a sell signal to lock in profits while they are still there.
As an overbought/oversold metric risk is greater the higher the index reading is showing diminishing rewards and the rewards become greater at low readings with diminishing risk.
On this index zero shows the maximum of extreme fear and 100 shows the maximum of extreme greed.
The Bitcoin fear and greed index is created from the following data sources. Each data point is valued the same as the day before in order to visualize a meaningful change in sentiment. This current index is for bitcoin only.
- Volatility (25 %)
Measures the current volatility and maximum drawdowns of bitcoin and compares it with the corresponding average values of the last 30 days and 90 days. An unusual rise in volatility is a sign of fear. - Market Momentum/Volume (25%)
Measures the current volume and market momentum in comparison with the last 30/90 day average values and adds those two values together. High buying volumes in an uptrending chart on a daily basis signals that the market is becoming too bullish. - Social Media (15%)
Twitter analysis gathers and counts posts on various hashtags for Bitcoin to measure sentiment. - Surveys (15%)
Strawpoll.com conducts weekly crypto polls and asks people how they see the Bitcoin market. - Dominance (10%)
The dominance of the Bitcoin market cap share of the whole crypto market. Bitcoin dominance is caused by fear as Bitcoin is becoming the safe haven of the crypto market. When Bitcoin dominance shrinks, crypto traders and investors are getting greedy by buying more risky alt-coins. Analyzing the dominance for a cryptocurrency other than Bitcoin, it could be the inverse, more interest in an altcoin may show greedy behavior for the whole crypto market. - Trends (10%)
Google Trends data is used for Bitcoin related search especially the change of search volumes.

The Bitcoin fear and greed index can be found on alternative.me.
